Case Study
1. Introduction
As systems become increasingly complex, it becomes more important - and simultaneously more difficult - to understand what is going on within them. The ability to monitor such systems and efficiently access specific information about them is vital.
Arroyo
An arroyo is a creek bed or gulch that temporarily fills with water after sufficient rain.

Arroyo is a lightweight framework that granularly rehydrates logs kept in cloud storage.
Memely
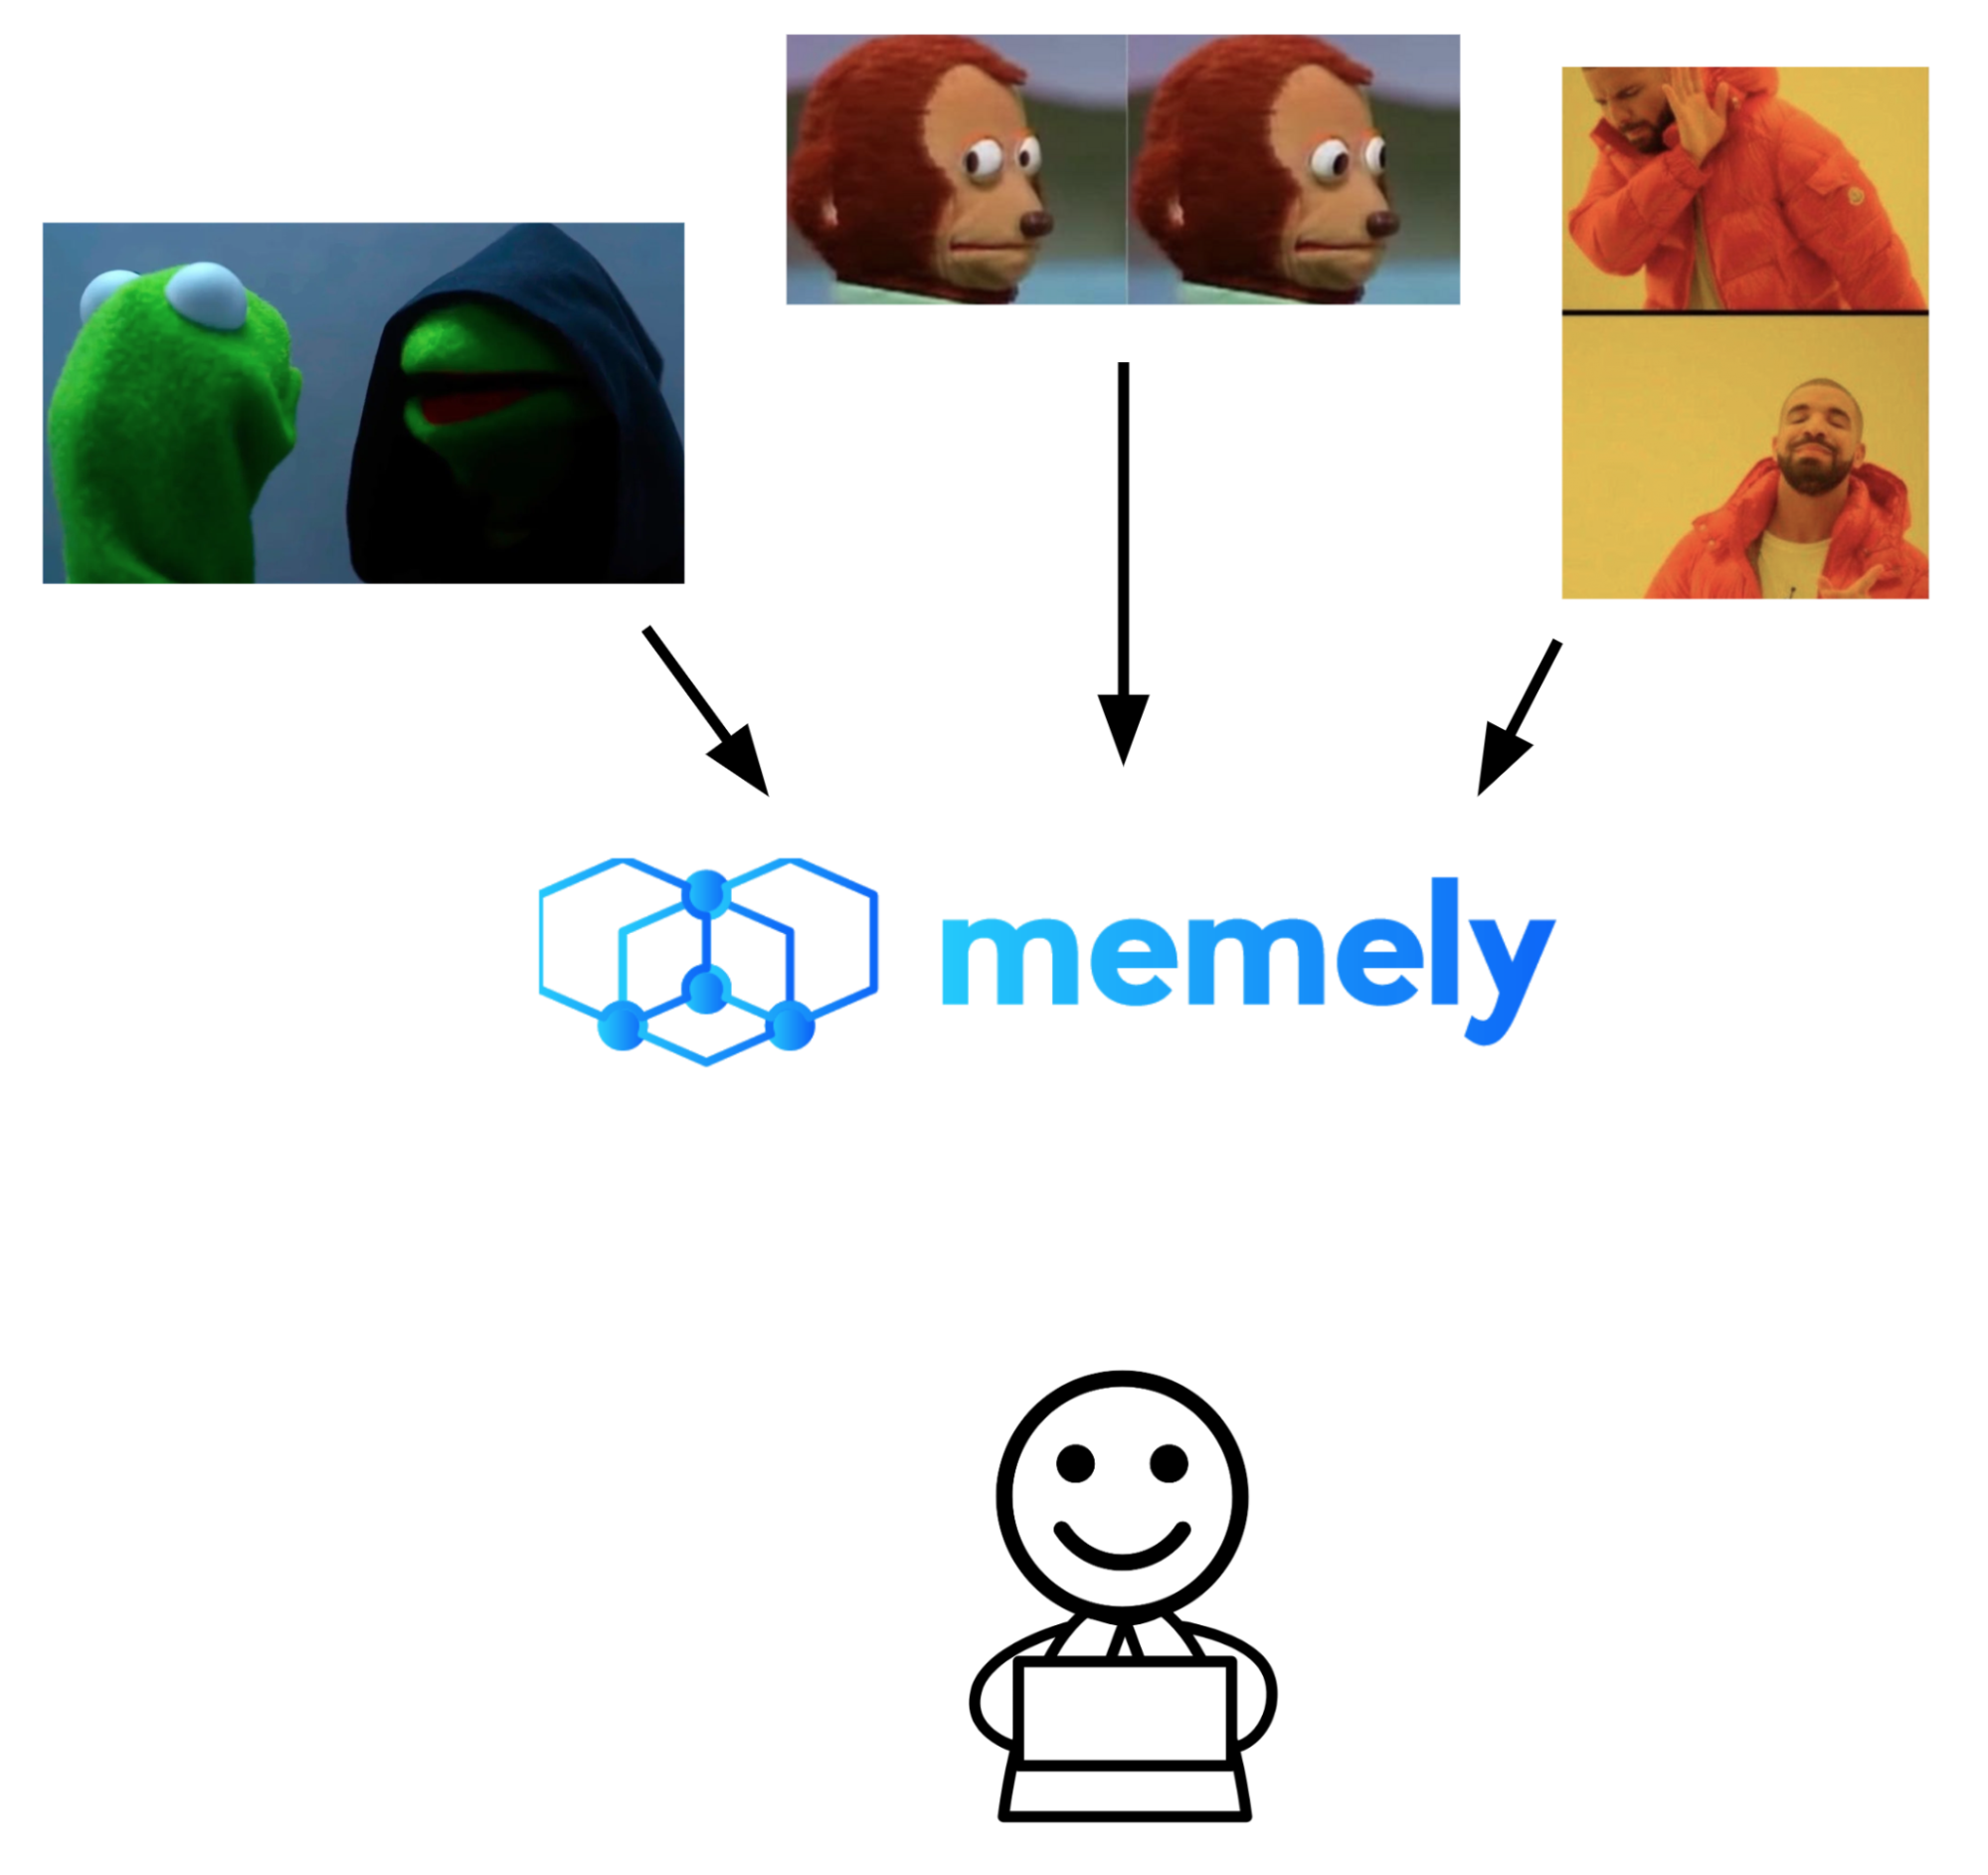
To help illustrate what Arroyo is and why it is useful, let’s meet Memely.
Memely is a small image and video hosting service that strives to provide a “one-stop shop for non-stop laughs” by consolidating the most popular content being shared across the web into one place.
Memely.com was not an overnight sensation, but over time their user base has grown considerably, exceeding even their most ambitious predictions. This growth enabled the Memely team to start generating pay-per-click ad revenue by hosting ads on their front page. With time, these profits became consistent and substantial enough that Memely was able to reinvest in their site by hiring a small team of full-time developers.
The engineering team’s first priority was to scale the Memely architecture to accommodate their growing user base. During the initial phase of infrastructural scaling, the complexity of Memely’s system increased considerably, and it quickly became clear that the current system did not contain the level of observability required to continue scaling confidently.
To complicate matters further, some troubling user behavior has necessitated an audit. The ad agency which Memely’s site hosts ads from is concerned about possible “click fraud”.

Over the past month the number of clicks, or “user engagements”, with the ads the agency generates and that memely.com hosts were far higher than usual. The agency has asked that the Memely team investigate: no small feat in Memely’s increasingly complex infrastructure.
2. Observability

Observability is the ability to measure the current state of a system using the data the system outputs. Instrumentation is adding code to output that data. The collection of these instrument measurements is called telemetry.
The Pillars of Observability
Observability is often said to be composed of three “pillars”: metrics, traces, and logs.
Metrics
Metrics provide numeric information about the state of a service at runtime. Typically, metrics are aggregations of data over a period of time.
The most commonly used metrics are availability, request rate, utilization, and latency. Availability represents the number of requests to a service that result in errors; request rate is a measure of requests per second; utilization is a numerical expression of a system’s CPU or memory usage; and latency is a measure of a system’s response time. These key metrics are often referred to as the ‘Four Golden Signals’.
Traces
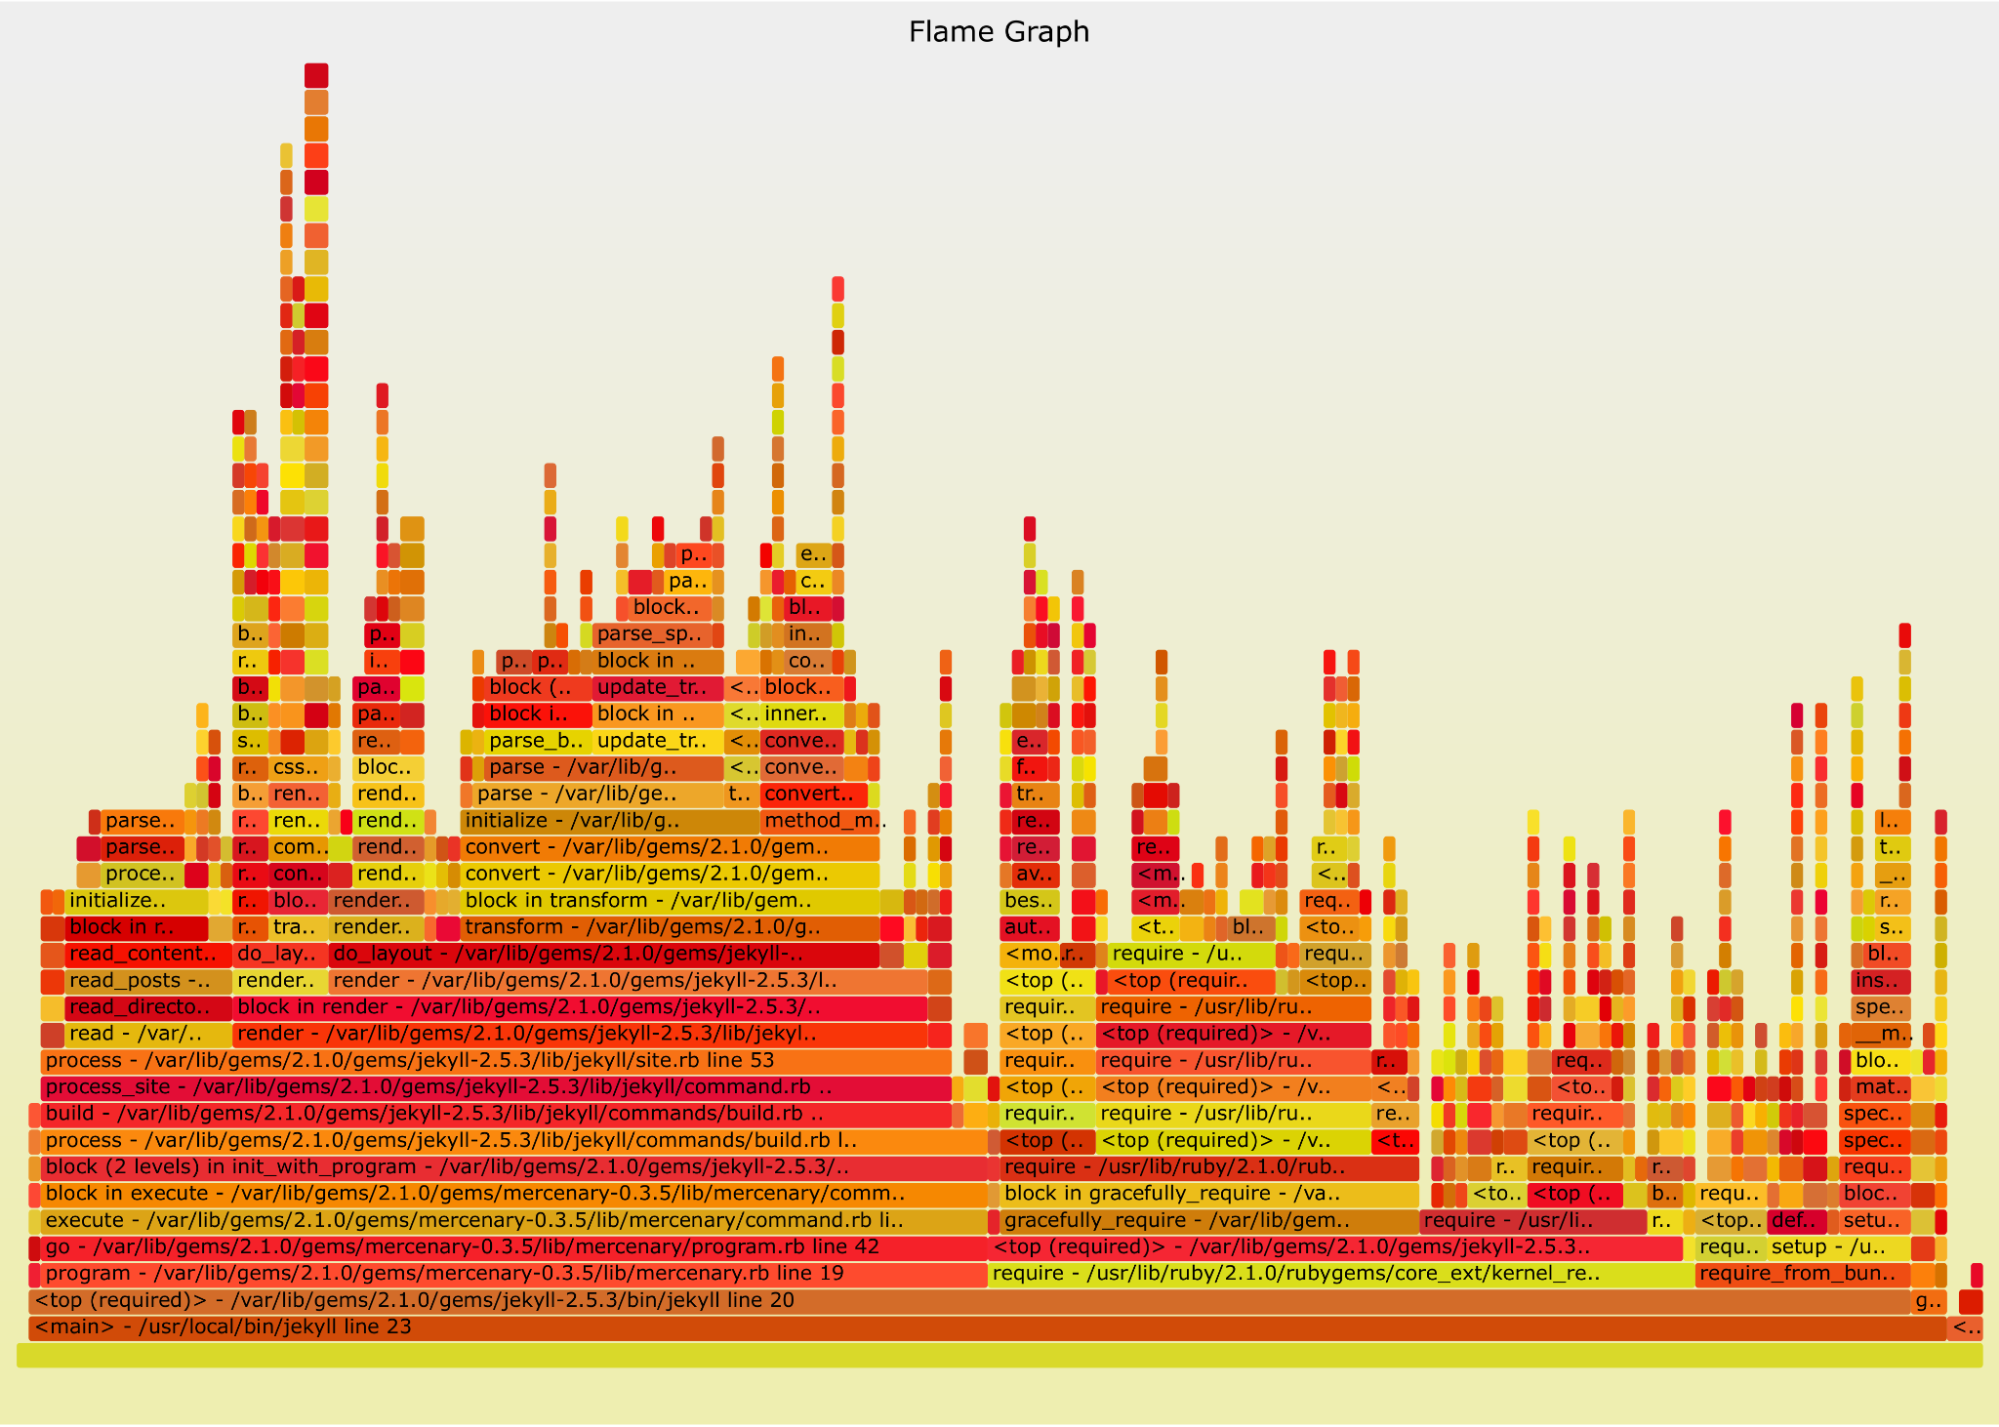
Traces record the paths taken by individual requests through a distributed system over time. Each trace is built from multiple spans, which represent time intervals during which discrete operations occur: an API call, or a database write operation. Typically traces are represented by showing a collection of spans organized by time in a waterfall diagram or a flame graph.
Logs
Logs are text records of events, and ideally include a timestamp. They come in various structured formats including JSON, CSV, and Common Event Format (CEF), but logs can be completely unstructured as well. Logs provide the most detailed view of what is going on within an application or service.
As a system grows, the number of metrics stays constant due to the aggregate nature of metrics. Traces increase linearly with the amount of requests; the complexity of the system does not impact the amount of traces. However, for the same increase in system complexity, the amount of logs increases faster than the number of traces or metrics.
Scaling Logs
Although logs are useful for gaining insight into a system, they don’t scale well. This is particularly evident in distributed systems.
Every component of a system’s architecture is likely to produce logs. When services are added to an infrastructure, those nodes will also produce more logs, which by default are stored locally. When logs are stored locally, users must first correctly identify the node containing the desired log entries. As the number of nodes increases, it rapidly becomes infeasible to identify the correct node manually.
Therefore, to find the information needed within a distributed system or with a large volume of logs, it is necessary to gather the logs into a centralized location to more efficiently perform searches and analysis there. One popular log management system is called the ELK stack, which is an acronym for the three tools it is composed of: Elasticsearch, Logstash, and Kibana.
ELK Stack
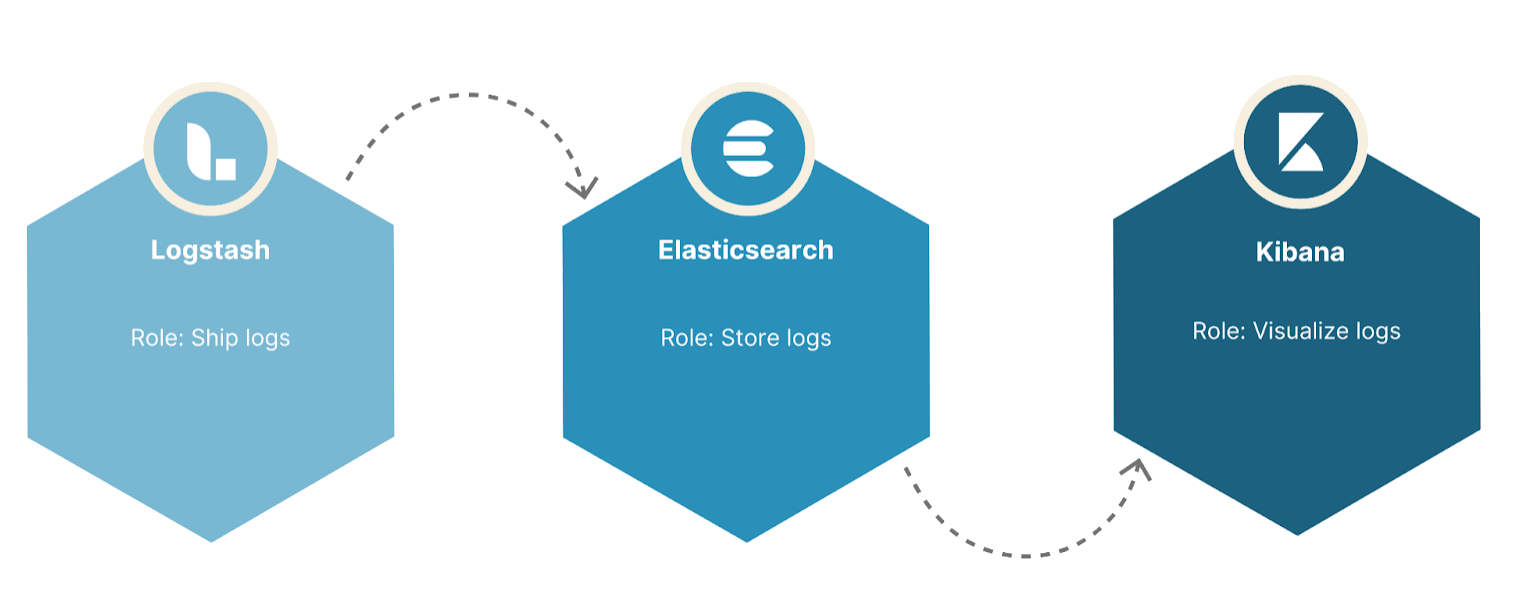
Logstash
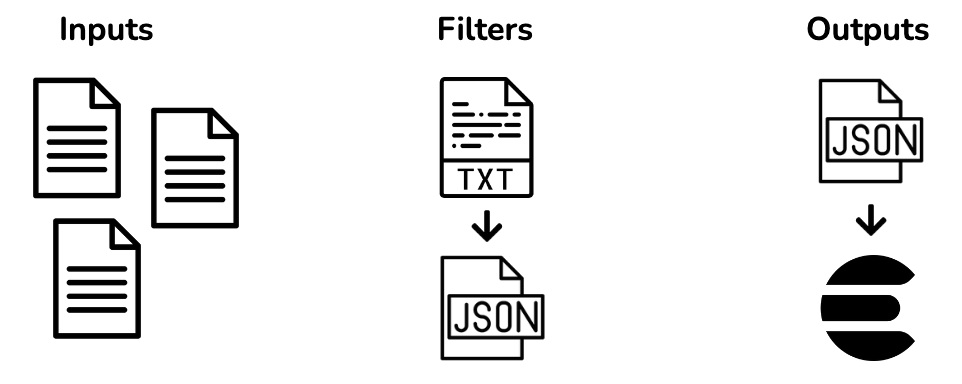
Logstash is a plugin-based data processing pipeline. Its functionality can be broken into three phases: input, transformation, and output. In the case of log management, Logstash takes in the text files where logs are stored (input phase); transforms these text files into a format that is more conducive to searching, like JSON (transformation phase); and sends the transformed data elsewhere for storage (output phase) In an ELK stack, the transformed data is sent to Elasticsearch.
Elasticsearch
Elasticsearch is a flexible tool that can serve as a distributed document store, a real-time search engine, and an analytics engine.
Elasticsearch can be described as “real-time” because it can index incoming data to make the data searchable in one second. An index in Elasticsearch is like a database in a relational database management system(RDBMS). However, in contrast to a relational database, it is easy to search multiple indexes; therefore, when using Elasticsearch for logs, each day is usually given its own index.
To search indexed data, users can write queries with either a domain specific language for searching JSON files, with SQL, or with Event Query Language (EQL). Also, searches can be run on aggregate data such as metrics. Once indexed, searchable logs are kept in Elasticsearch.
However, the more data stored in Elasticsearch, the slower searching will be. To keep searching performant , the amount of data kept in Elasticsearch must be minimized . One way of managing the data contained in Elasticsearch is by using an index lifecycle policy, which enables a high degree of control over how long an index will be retained. For example, an index may be deleted once it has been stored in Elasticsearch for a certain amount of time.

While searching for information can be performed via the Elasticsearch API, the search results will be presented as a JSON document. For information-rich data, such as logs, it is beneficial to visualize the data in order to understand the state of a system at a glance and make informed decisions. JSON may not succinctly summarize the results in a visually impactful format which is why the ELK stack includes a visualization tool called Kibana.
Kibana

Kibana is a graphical user interface that lets users visualize their data by allowing them to flexibly query Elasticsearch, to create graphs, and to build custom dashboards. Visualizing information-rich data, such as logs, allows users to see what is happening within their system at a glance.
In addition, Kibana allows users to manage their Elasticsearch cluster in a more intuitive environment by allowing users to perform administrative tasks like creating index lifecycle policies in the Kibana dashboard. Otherwise, users would need to manage Elasticsearch via its API.
The ELK stack allows users to aggregate and analyze logs, and to create visualizations for application and infrastructure monitoring. Using the ELK stack for log management is a great step towards achieving an observable system, especially if it’s combined with a system for managing traces and metrics. With the three pillars of observability in mind, let’s return to Memely to see how they use their ELK Stack to collect, search, and analyze their logs.
3. Log Rehydration
Memely’s ELK Stack
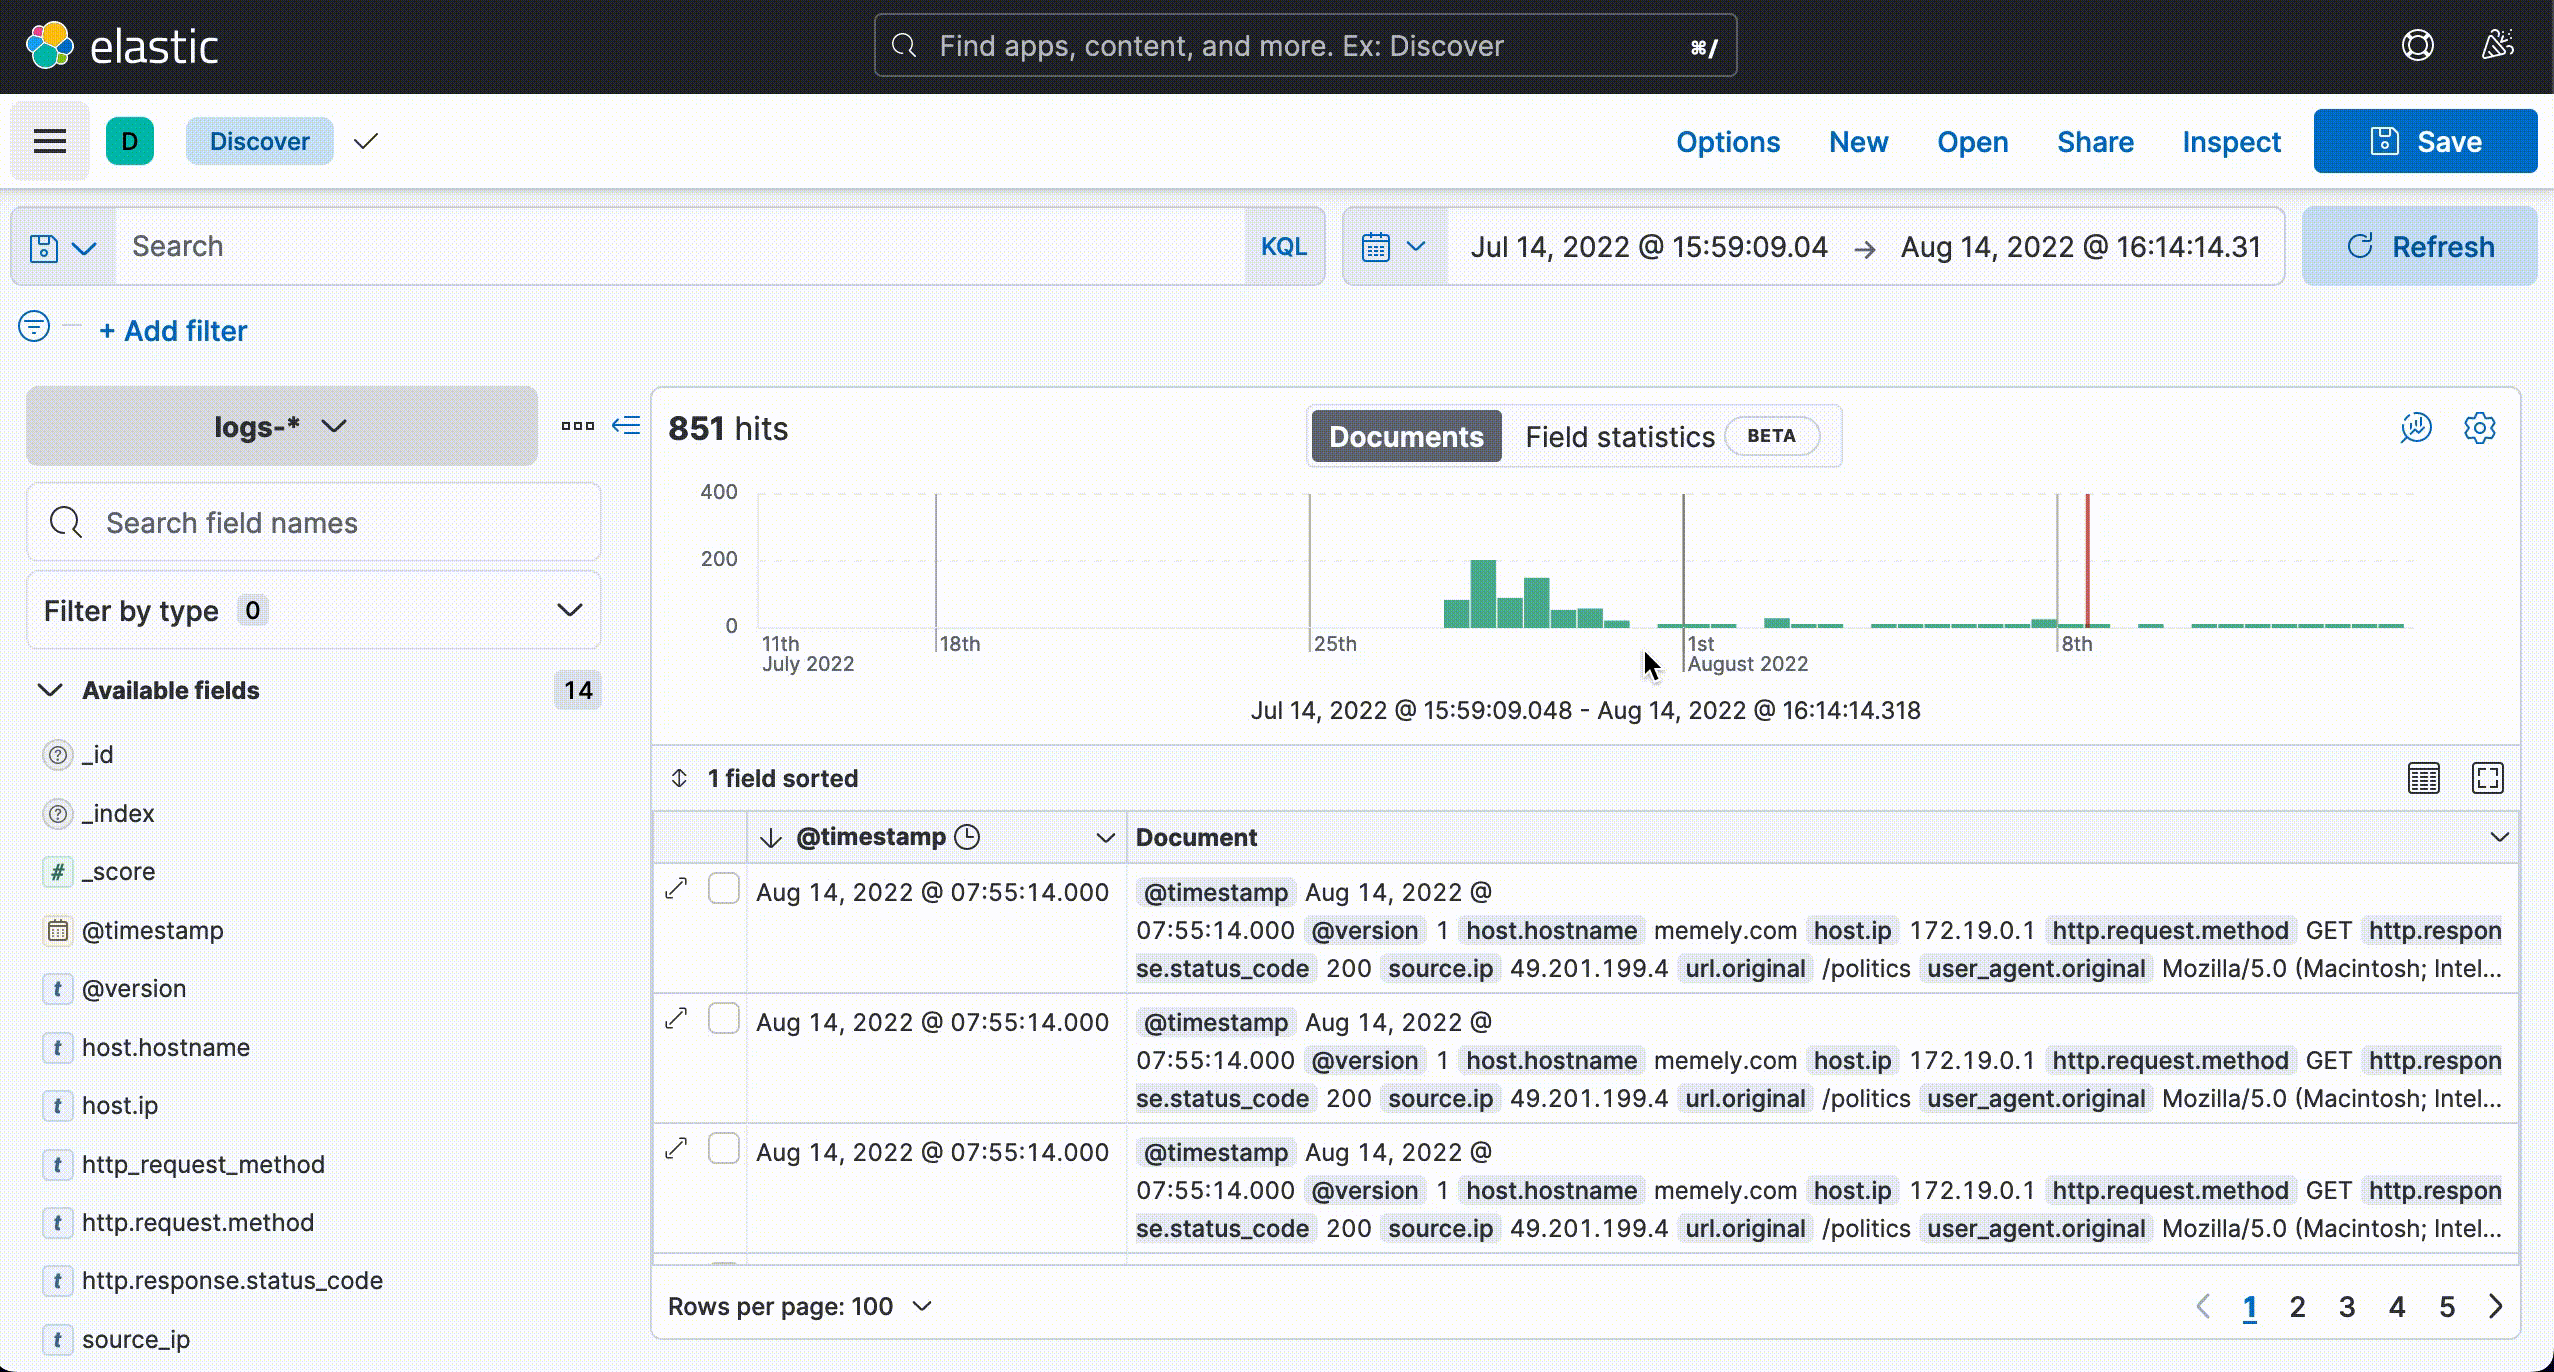
After implementing an ELK stack of their own, the Memely team can search all of the logs generated by the Memely infrastructure, which has allowed them to derive metrics based on the data the logs contain. For example, the team can visualize their web server logs and analyze server response times to gauge how memely.com’s growing user base has impacted the site’s availability. With the added oversight that an ELK stack provides, the Memely team feels more confident about their current scaling efforts.
However, utilizing an ELK stack has introduced a separate set of challenges for the Memely team. Elasticsearch's strength is fast searching, but the search speed slows as the number of documents increases. Additionally, increasing the number of documents introduces complexity concerning index management and memory allocation within Elasticsearch.
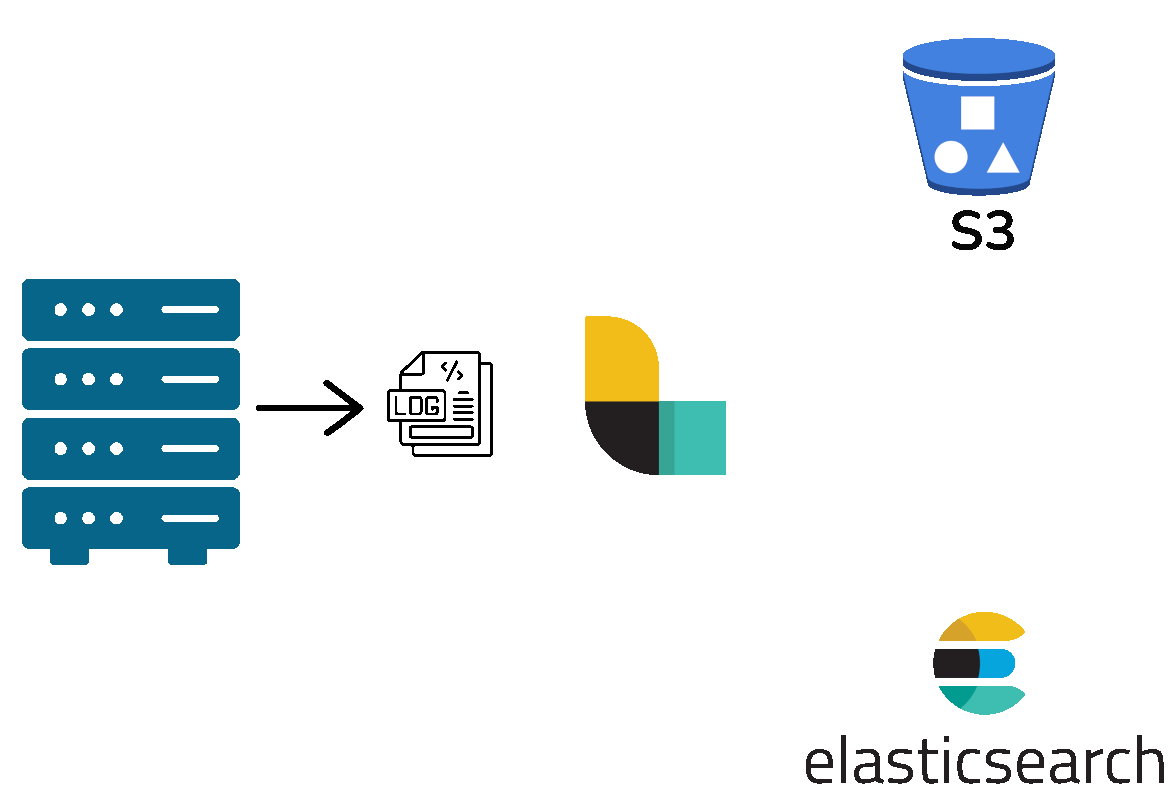
To address these challenges, the Memely team decides to store their logs in two locations. First, Memely will ship their logs to AWS S3 for archival. Second, to keep Elasticsearch manageable and performant, Memely will index only the most recent 14 days' worth of logs into Elasticsearch. This solution reduces the number of documents stored in Elasticsearch and grants the Memely team peace of mind knowing all their logs are archived in secure cloud storage.
The Audit
Suspicious Client IP
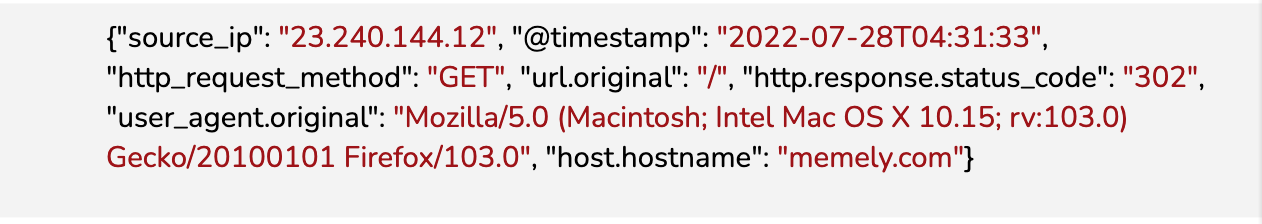
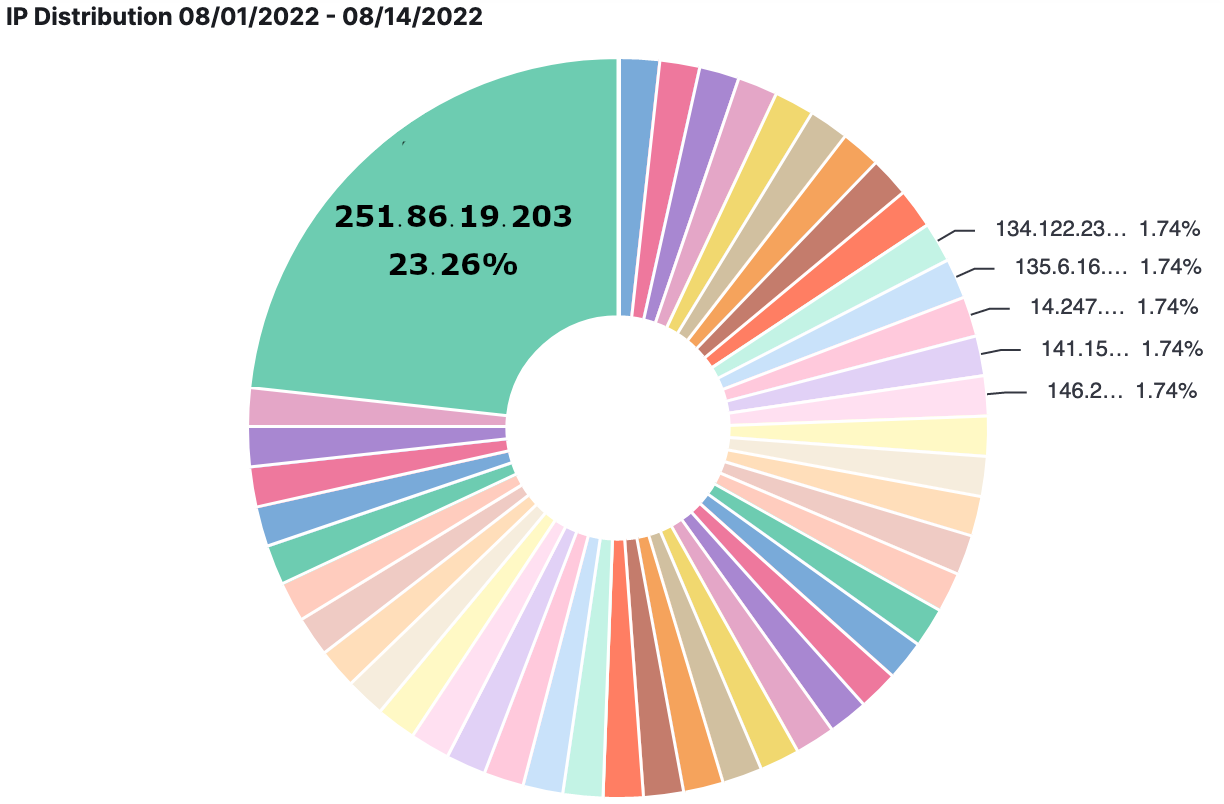
When we last left Memely, the ad agency that memely.com hosts ads from had requested that Memely investigate a suspiciously high number of user engagements that indicated an event of “click fraud”. Thanks to their new ELK Stack, Memely team was quickly able to gather information about the requests made to memely.com over the previous two weeks. Memely’s ELK Stack played an invaluable role here, and the team was quickly able to establish that one client IP address was responsible for a drastically disproportionate number of the requests made in the previous 14 days.
Suspicious Behavior
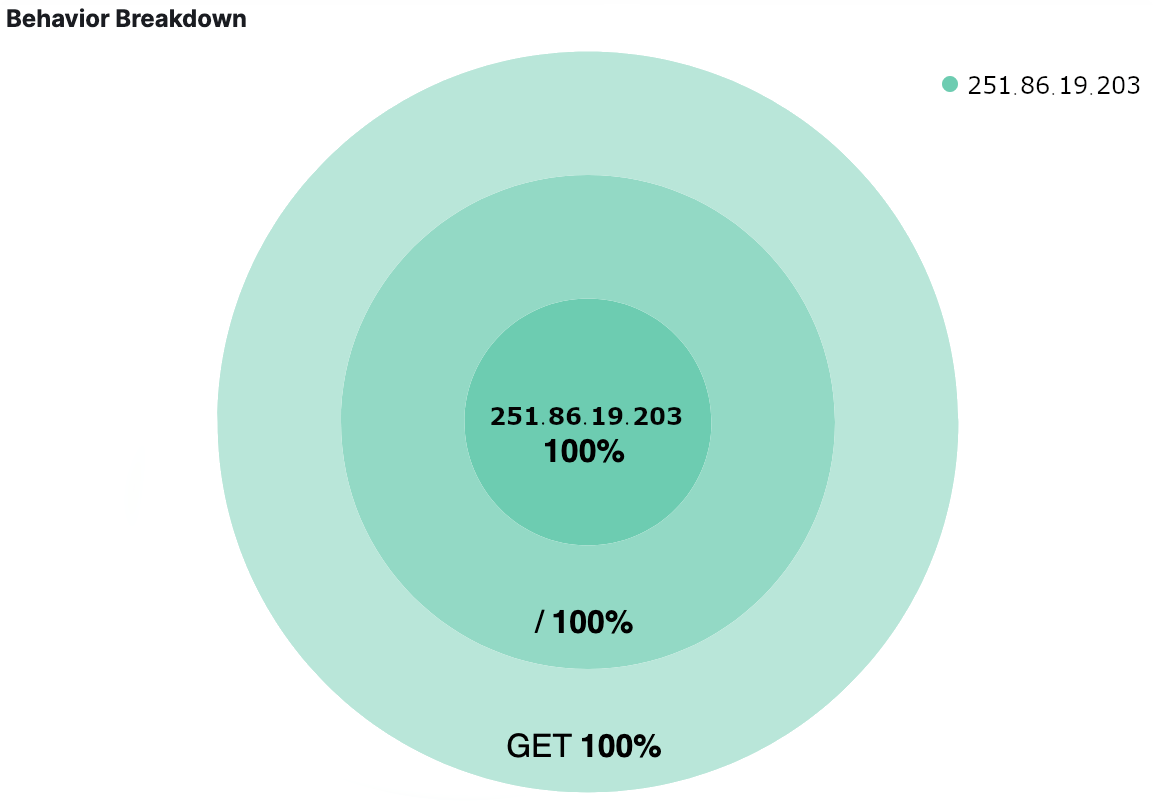
In order to better understand how this client had been interacting with their site, the Memely team looked at all of the indexed web server logs involving the client’s IP address. They discovered that all of the requests issued by the client had been GET requests sent to the root page of memely.com, where the majority of the hosted ads are served. They also observed that the client made no attempts to visit any other pages within the site, which deviates from the way that most users interact with their site. At this point the Memely team is confident that they are dealing with a malicious user, reinforcing suspicions that memely.com experienced click fraud within the past 30 days.
The next thing the Memely team would like to know is how long this has been going on. Because they only have the most recent 14 days of logs indexed in Elasticsearch, the Memely team does not currently have all of the data that they need in order to complete their audit.
Log Rehydration
What the Memely team needs is a way to transfer logs they currently have archived in AWS S3 back into Elasticsearch so that they can search them within an environment that is feature-rich and familiar. This process of transferring archived logs back into Elasticsearch for easier searching is often referred to as log rehydration and the Memely team has a few options at their disposal.
4. Existing Solutions
Commercial Solutions
There is no shortage of commercially available observability solutions offering log rehydration. They all boast a multitude of features, and many are all-in-one solutions, meaning that users do not need to concern themselves with scaling complexities or infrastructure management because the entire log management workflow has been taken care of.

While a commercial solution is an option the Memely team could explore, they have some reservations.
As a small company with limited resources, Memely would like to avoid the cost of a commercial solution. At the very least, the Memely team wants to avoid paying for any features they do not need. Many commercial tools are geared toward enterprise companies, offering features like machine learning integration and business intelligence - features that are currently out of scope for Memely.
Additionally, most commercial solutions would replace their existing ELK stack, and with the audit going on, the Memely team wants to minimize - as much as possible - the time it may take to get up to speed with a new tool.
DIY Solutions
If a commercial solution doesn't fit Memely's needs, they could look to utilize open-source tools that transfer logs from AWS S3 into Elasticsearch. For example, because the Memely team is already using an ELK stack, they could utilize the Logstash S3 input plugin, allowing them to stream archived logs back into Elasticsearch. This seems like a viable solution at first glance; the Memely team could save on cost using a free plugin, and the Logstash S3 input plugin readily integrates with their existing ELK stack.
However, the default behavior of the Logstash S3 input plugin is to rehydrate all the log files within an S3 bucket. Therefore, if the Memely team would like to perform rehydration on specific files, they would need to experiment with exclusion patterns within their S3 input plugin's configuration file which would require skilled use of regular expressions along with some trial and error.
In addition, for their audit and to reduce their impact on Elasticsearch's capacity, the Memely team may only want to rehydrate the log lines that pertain to the spammy client they identified during their preliminary audit. Unfortunately, the Logstash S3 input plugin cannot provide this level of granularity when attempting to rehydrate logs. Utilizing it will likely introduce excess data into Elasticsearch, from which the Memely team may derive little value.
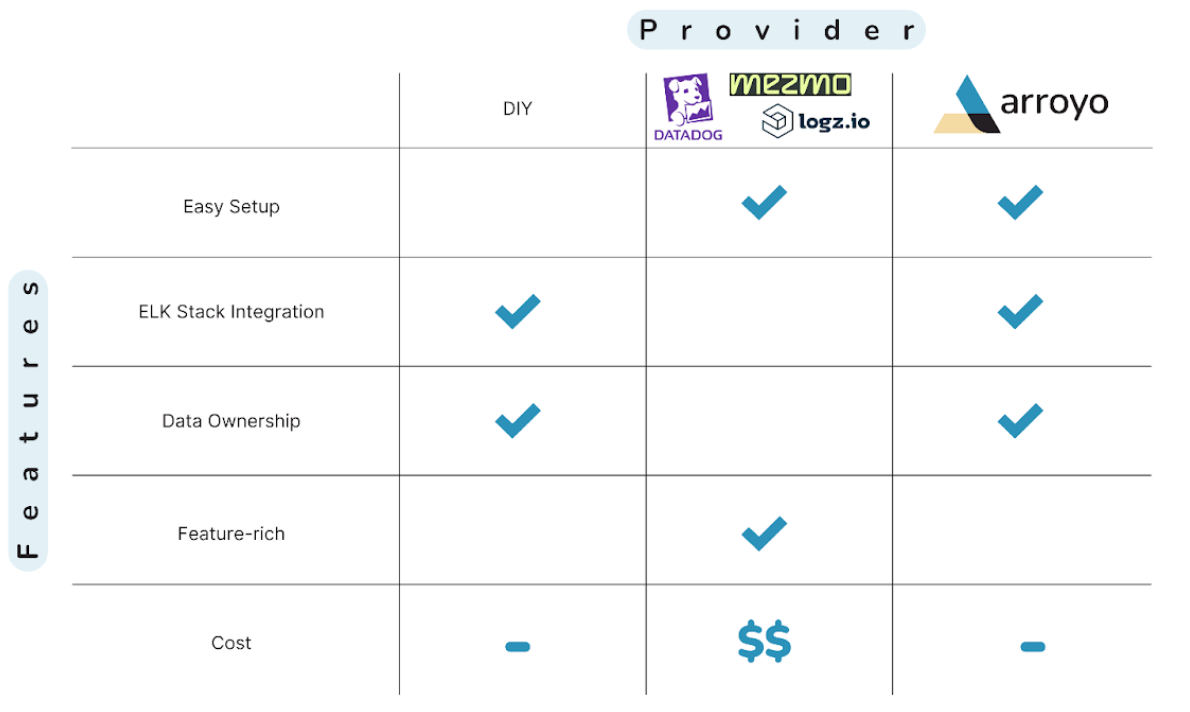
Ideally, the Memely team needs a tool to rehydrate logs that is easy to use, like a commercial solution, while still integrating with their existing ELK stack to reduce monetary costs.
Luckily, there is another option to consider, Arroyo. The scarcity of open-sourced rehydration tools is one of the primary reasons we decided to build Arroyo.
5. Arroyo
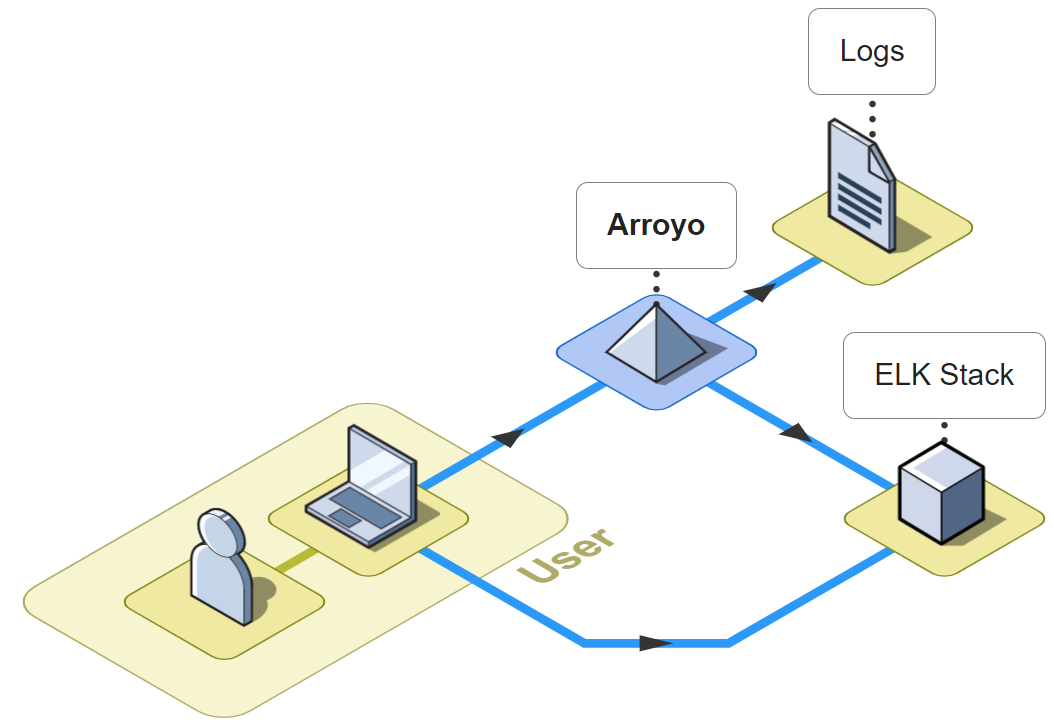
Arroyo is a lightweight framework that facilitates the rehydration of logs, granting users the ability to select a specific timeframe to search for relevant log files. Additionally, Arroyo supports query searching; a user can provide log attributes in order to conditionally rehydrate logs for more granular control over what data is rehydrated. Search results are retrieved from a user's AWS S3 bucket and reingested into Elasticsearch.
6. Using Arroyo
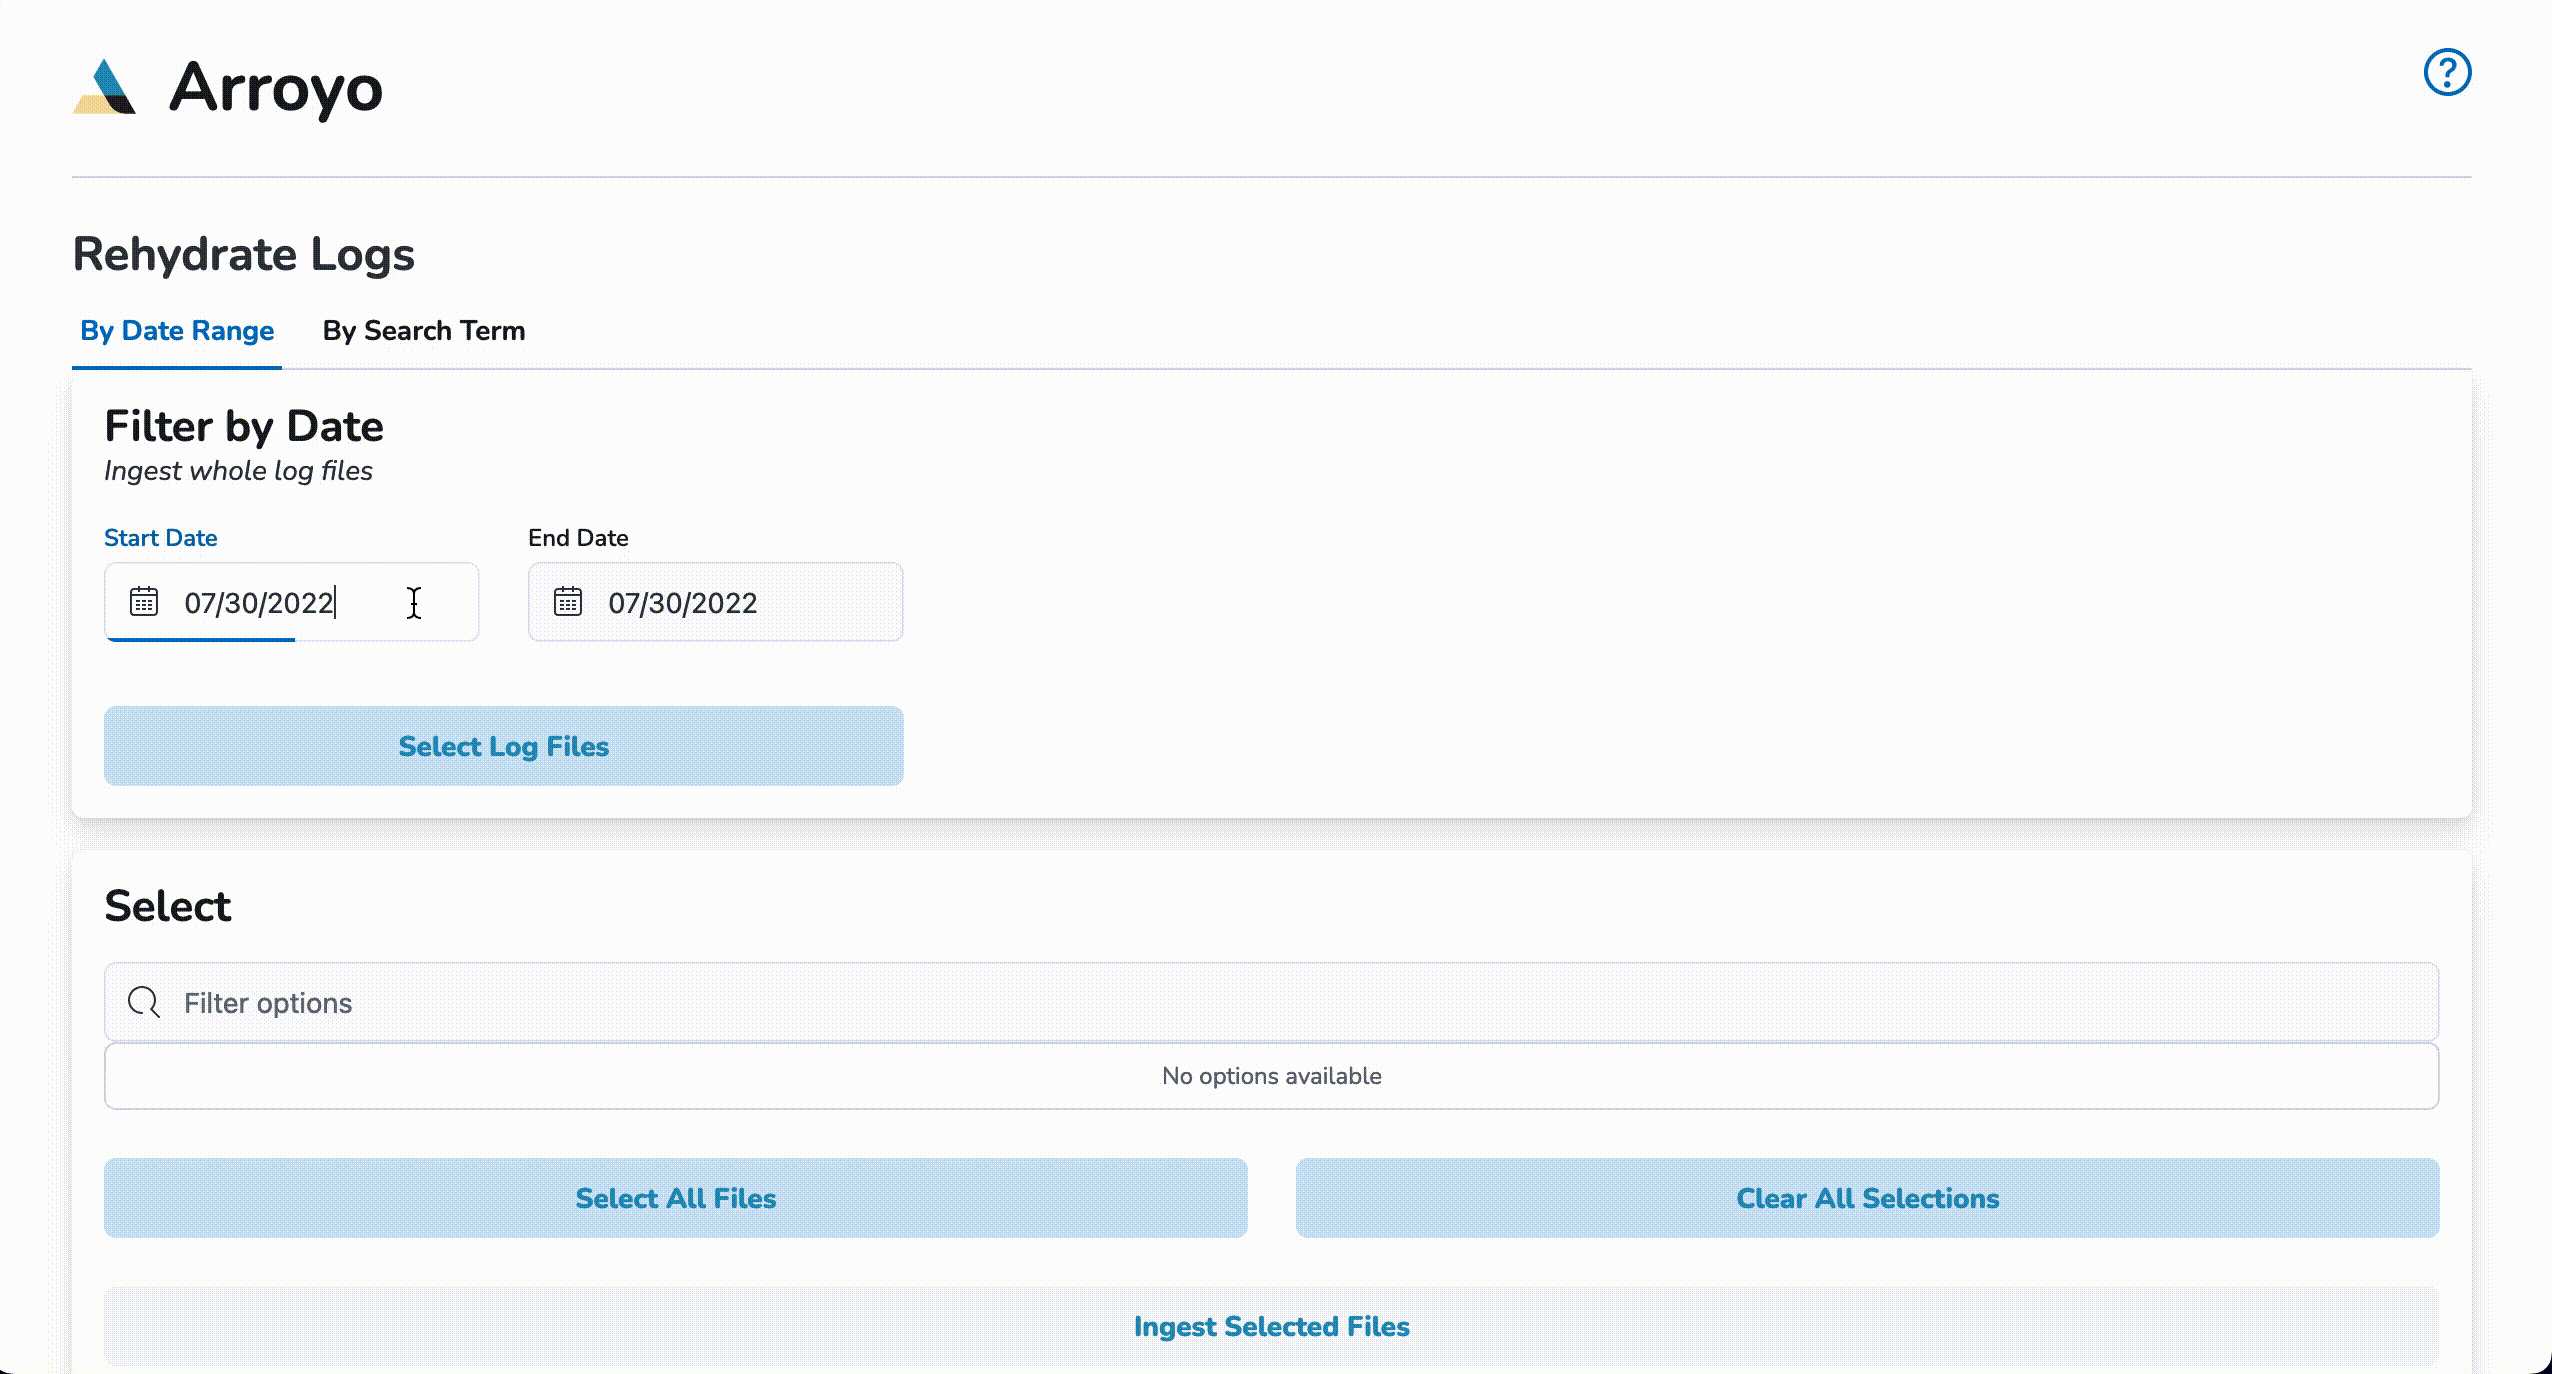
Rehydration
Arroyo offers two ways to rehydrate a user's archived logs; bulk rehydration and a query rehydrate option. Bulk rehydration allows a user to re-ingest whole log files. In contrast, Arroyo's query rehydration enables users to re-ingest only the most relevant log entries to reduce the impact on the capacity within Elasticsearch.
Bulk Rehydration
To start a bulk rehydration job, click on the By Date Range tab and enter a start date and an end date. Then, click on the Select Log Files button. A list of files generated within the entered date range will populate the list in the Select section. Choose the files to be rehydrated and click Ingest Selected Files. Once a notification of job completion is displayed, the newly rehydrated logs will be available for viewing in Kibana.
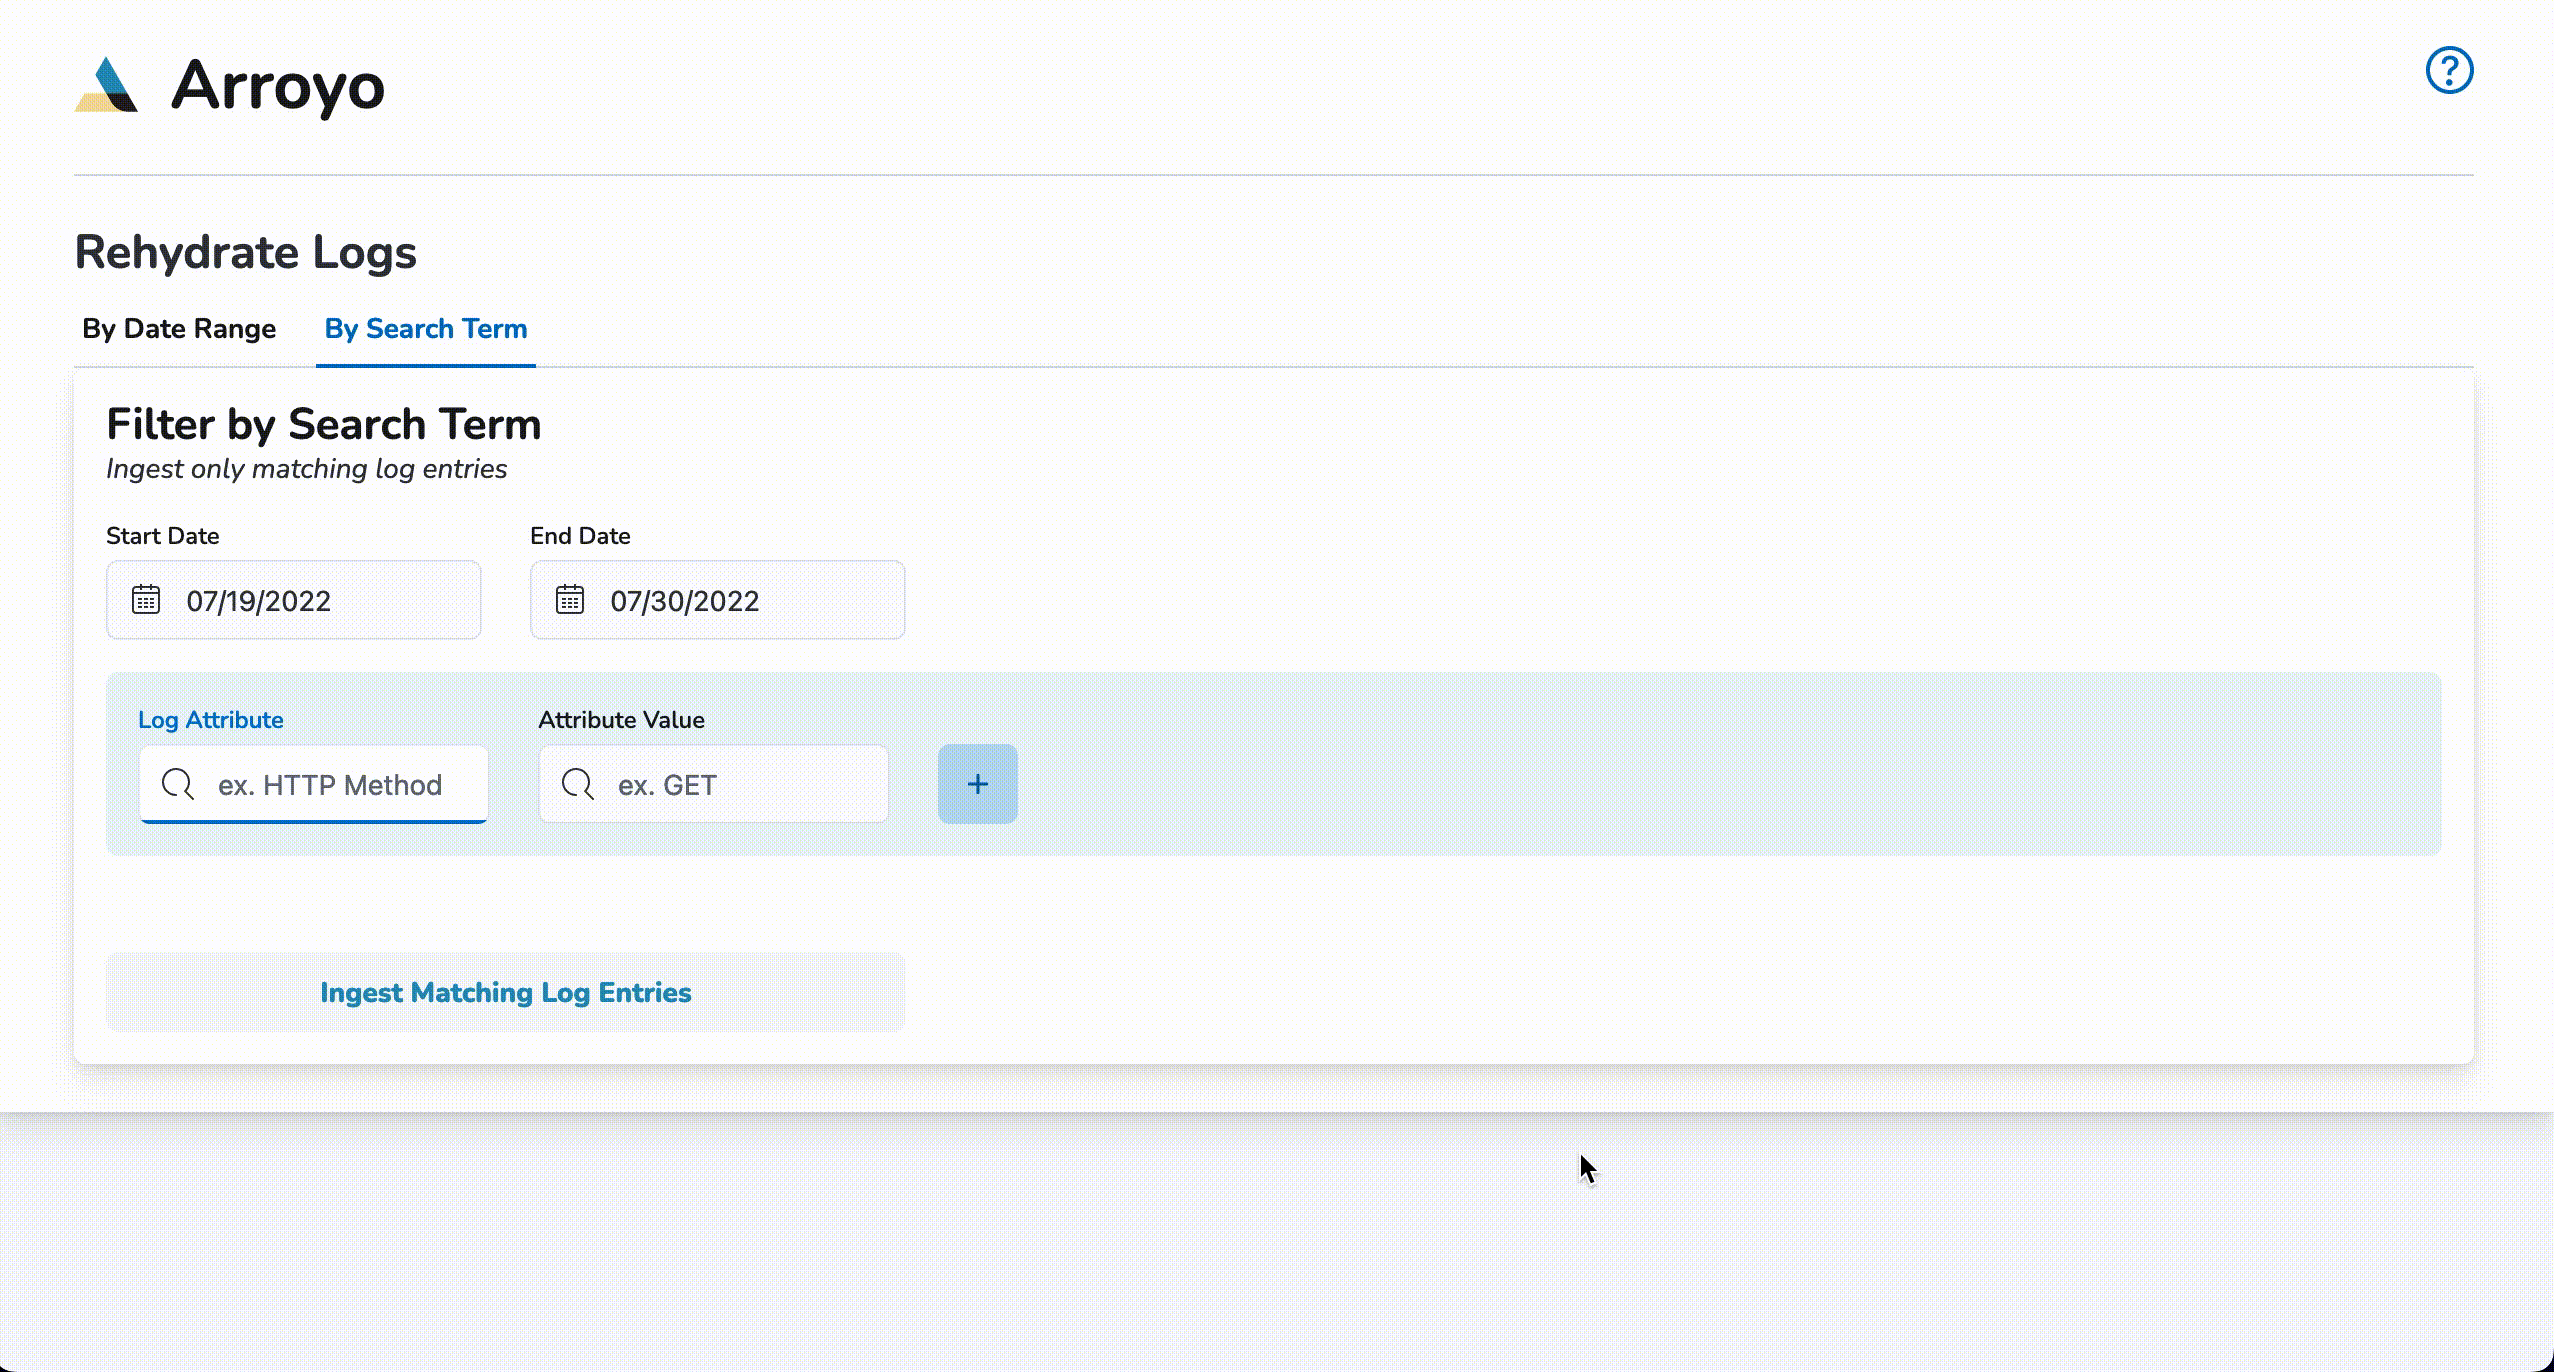
Query Rehydration
To start a query rehydrate job, click on the By Search Term tab and enter start and end dates. Next, enter a log attribute (I.e., request_method) and a log attribute value (I.e, GET) and click the plus (+) button. Up to two pairs of log attributes and their corresponding values may be entered. Once the desired queries have been entered, click on Ingest Matching Log Entries to begin re-ingestion. Once a notification of re-ingestion is displayed, the ingested log entries will be available to view within Kibana.
Index Cleanup
One of the challenges with using Elasticsearch is striking a balance between having too much information on hand and too little information. Arroyo reintroduces data into Elasticsearch, leading to questions surrounding data management. For example, how can users remove rehydrated data once they have derived its value?
Arroyo's proposed solution to these questions is to provide users with a Logstash configuration template that they may utilize to set up their Logstash HTTP input plugin. In addition, the provided template instructs Elasticsearch to create a new, separate index for rehydrated logs generated by Arroyo.
The creation of this new index allows users to delete the entire index and any rehydrated logs without deleting day-to-day logs. Our team designed Arroyo to integrate into a user's existing ELK stack, so ensuring that our application would not impede a user's existing workflow was critical.
The Logstash HTTP input template Arroyo provides is a guideline, but users are encouraged to configure their http input plugin to suit their use case.
For ease of data management, we encourage users to follow Arroyo's pattern of creating a new index for rehydration purposes.
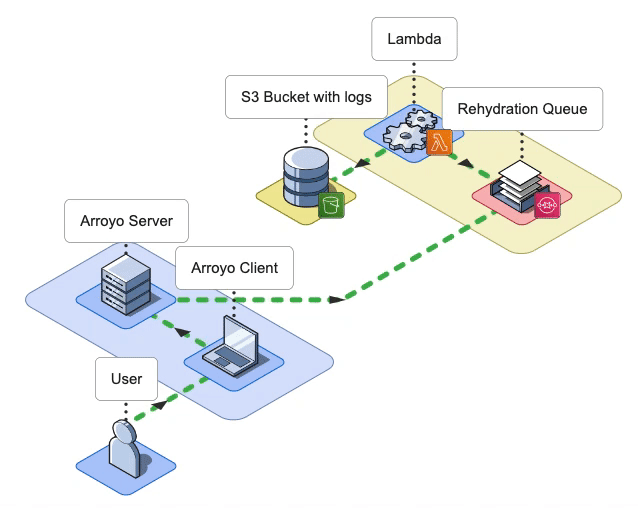
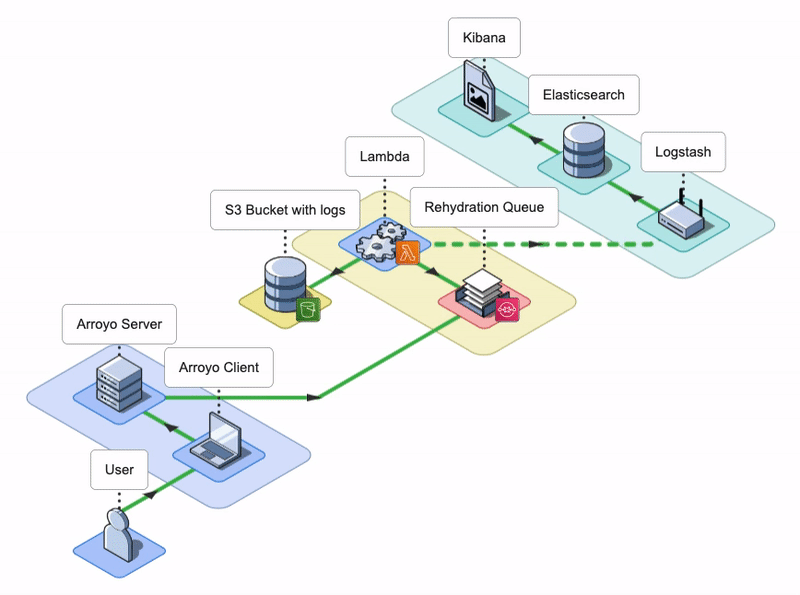
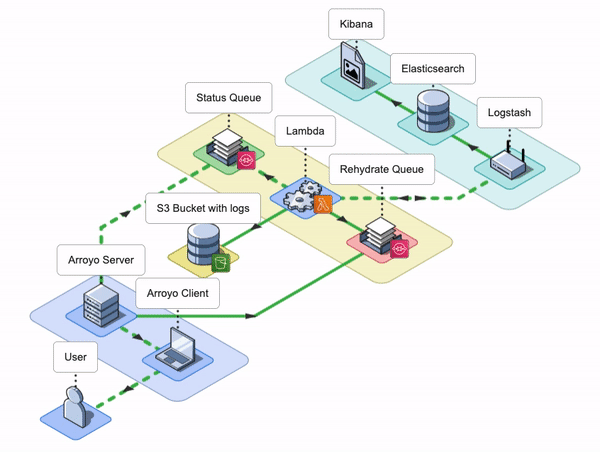
7. Arroyo Architecture
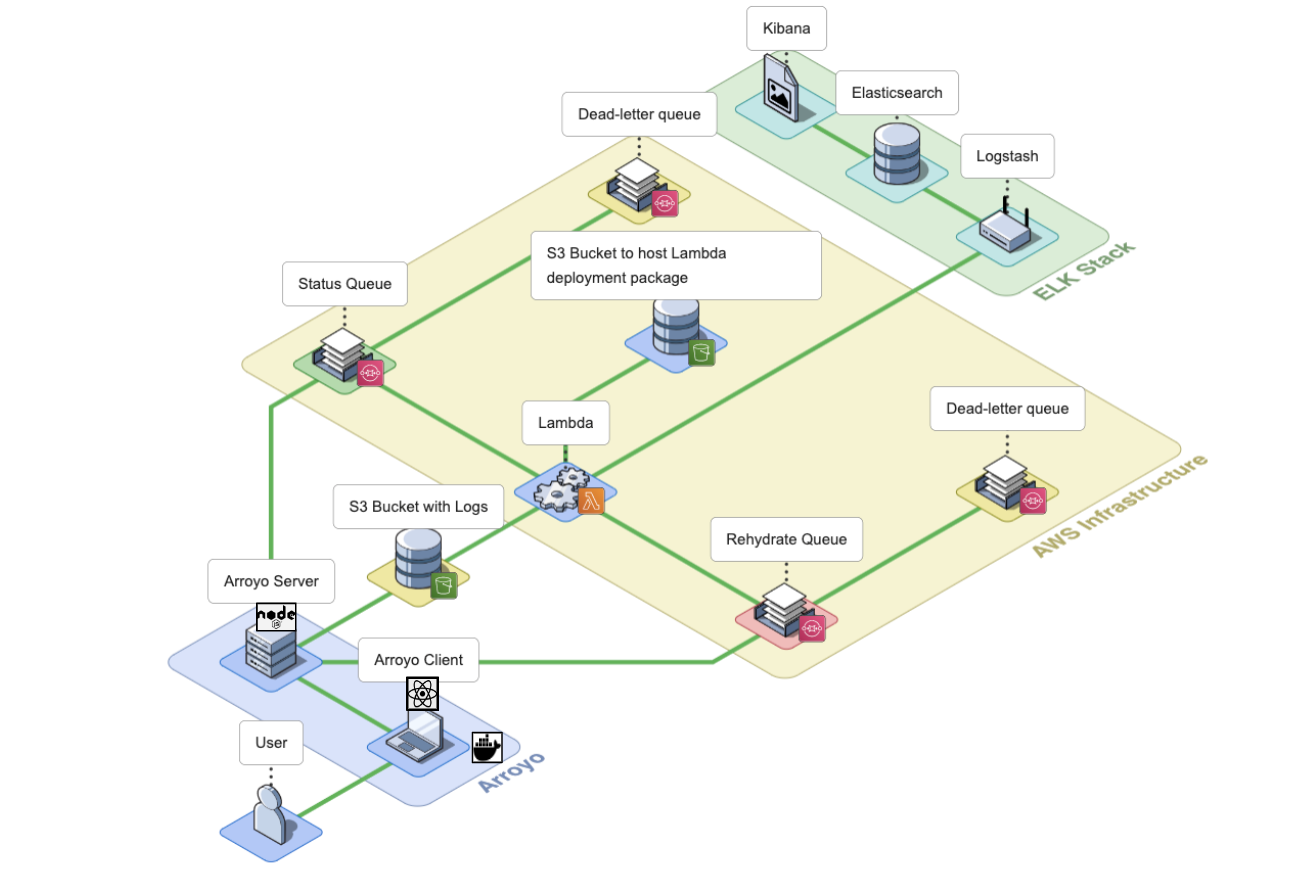
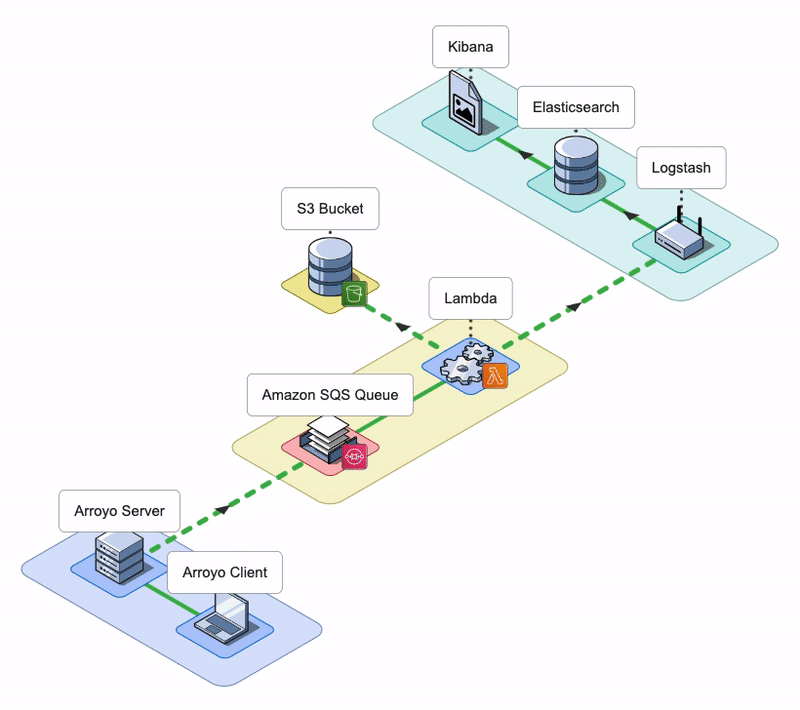
The Arroyo application consists of an Arroyo Client and an Arroyo Server; the Arroyo Client is a React application that provides the Arroyo UI, while the Arroyo Server is a Node application that interacts with AWS resources and facilitates the rehydration and re-ingestion of logs.
The Arroyo Client and Arroyo Server applications are containerized using Docker and Docker Compose.
Let’s go over AWS services that Arroyo uses to perform the rehydration of logs.
Arroyo AWS Resources
During the installation, Arroyo provisions several AWS resources programmatically using AWS SDK.
- Arroyo provisions four SQS Queues: two main SQS queues - a Rehydration SQS Queue and a Status SQS Queue - and their corresponding Dead Letter Queues (DLQ).
- Arroyo creates a separate S3 bucket to host the Lambda deployment package.
- Arroyo also creates an IAM role for the Lambda function. The role has all the permissions the Lambda will need to interact with other AWS services.
- Lastly, Arroyo creates the Lambda Function itself and sets the Rehydration SQS Queue as its Event trigger.
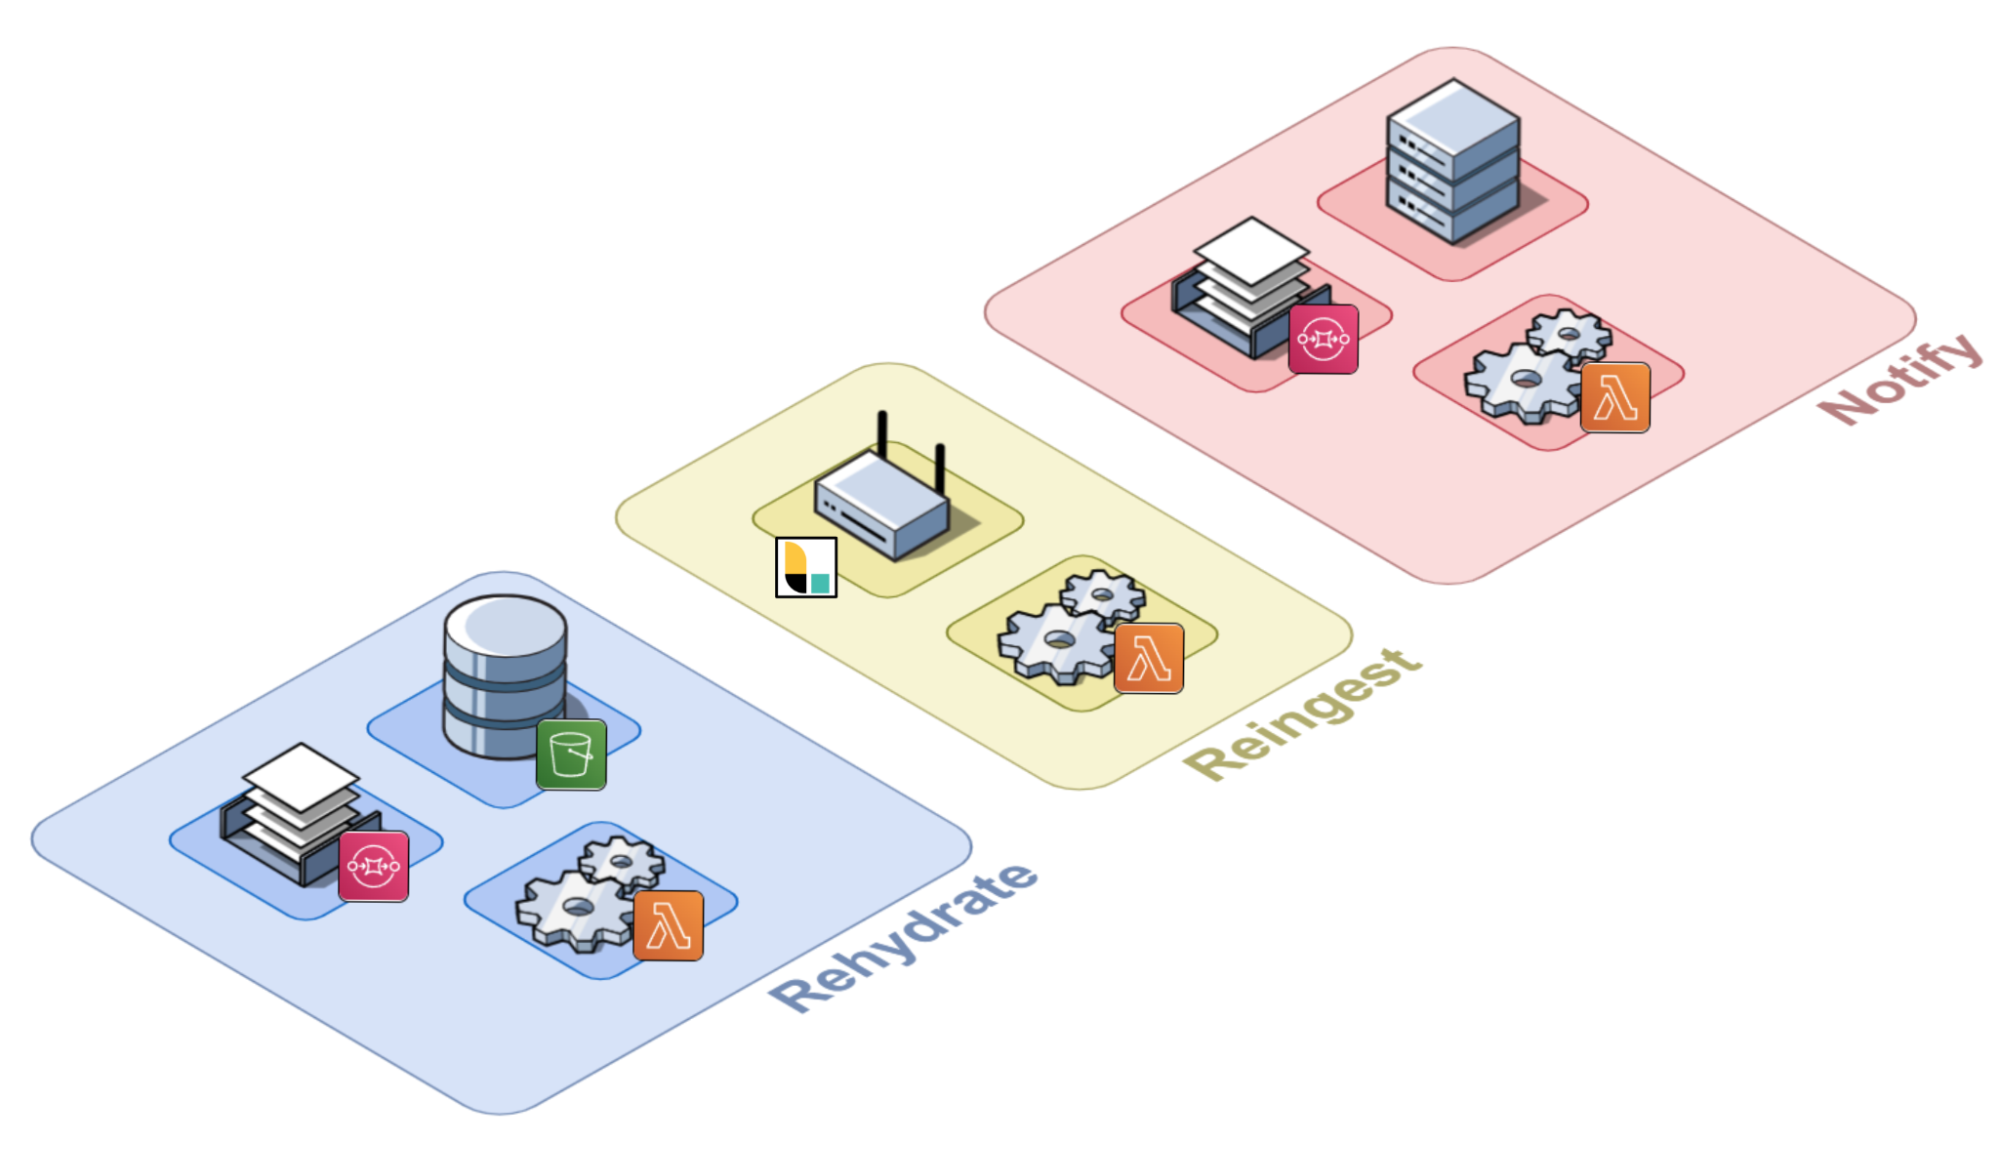
Conceptually, we can split the Arroyo application into three key phases: Rehydrate, Reingest, and Notify. Let’s take a look at each of them.
Rehydrate
During the Rehydrate phase, the first phase in the log rehydration pipeline, the Arroyo Server receives a list of file names from the Arroyo Client. The list contains all the files that need to be rehydrated from the user’s S3 bucket into their ELK stack. To rehydrate a file, the Arroyo application has to either download the entire file or query that specific file using the user-provided query. Once Arroyo rehydrates the log data from the S3 bucket, it then passes it to the next phase.
Let’s take a look at the Rehydrate phase more closely, where the user can perform either bulk log rehydration or query-based log rehydration.
Bulk Log Rehydration
In the case of bulk log rehydration, the user specifies a date range. The Arroyo Client passes that date range to the Arroyo Server.
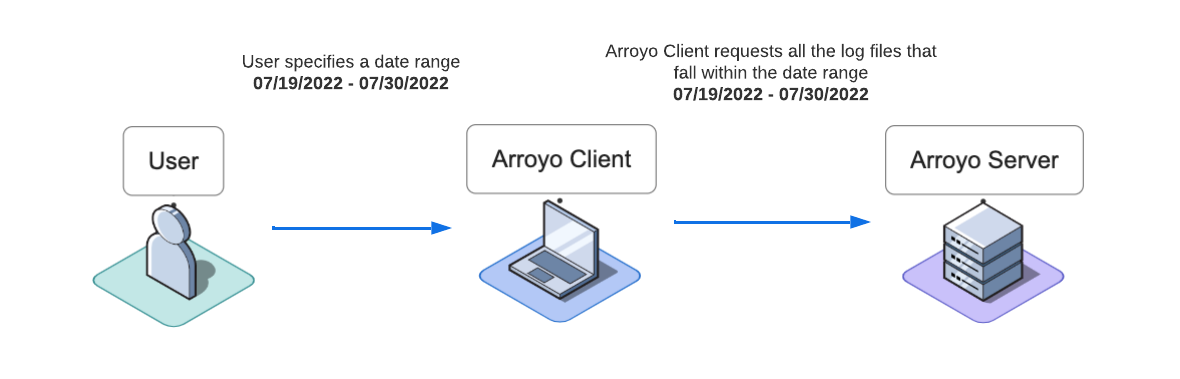
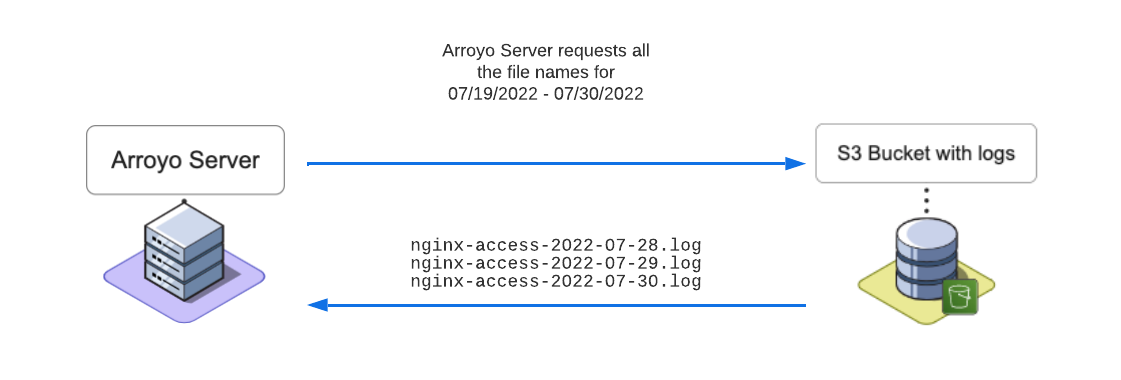
The Server then fetches the names of the log files (also called keys) that fall within that date range from the user’s S3 bucket.
The Server sends these keys to the Arroyo Client, which displays the file names to the user. The user may select the files that they would like to have rehydrated. Once the user clicks Ingest Selected Files, the Client forwards the selected file names to the Arroyo Server for rehydration.
Query-based Log Rehydration
If the user decides to submit query-based rehydration, they may specify up to two log attributes and their corresponding values (a query) in addition to a date range. Once the user submits their rehydration request, the Client forwards the date range with the query to the Arroyo Server for rehydration.
Once the Server receives the date range and an optional query from the Arroyo Client, it requests all of the files that fall within that date range, just as it does during bulk log rehydration. However, in this case, it does not forward the list to the Arroyo Client, and instead, it starts processing the rehydration request.
For each file name in the list, the Arroyo server creates a message and then places it onto the Rehydration SQS Queue. Within the body of the message, the Server includes the following information:
- The S3 Bucket name where logs are stored
- The Key that represents the name of the file to be queried or fetched
- The Logstash endpoint where Lambda will send the logs to
- The SQL expression, built by the Arroyo Server using the search terms provided by the user
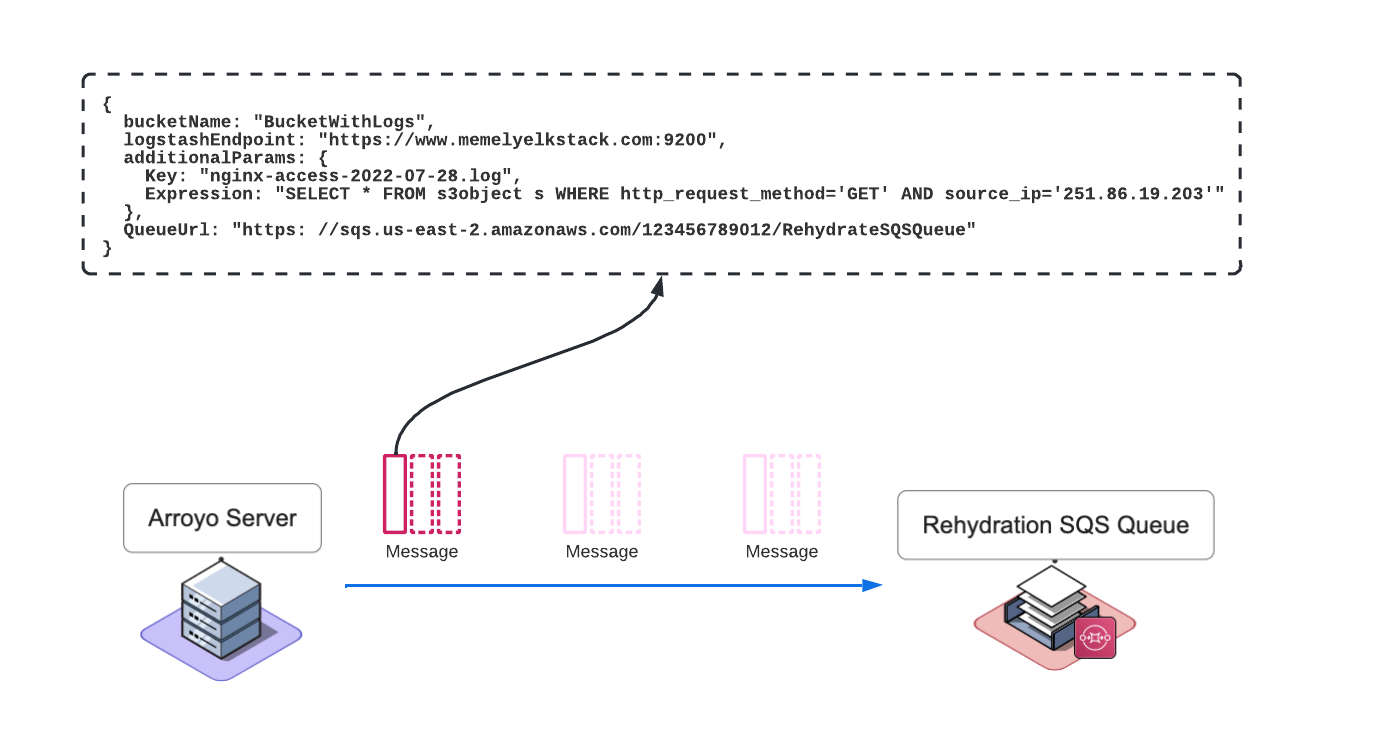
Once the first message is placed on the queue by Server, the Lambda function spins up.
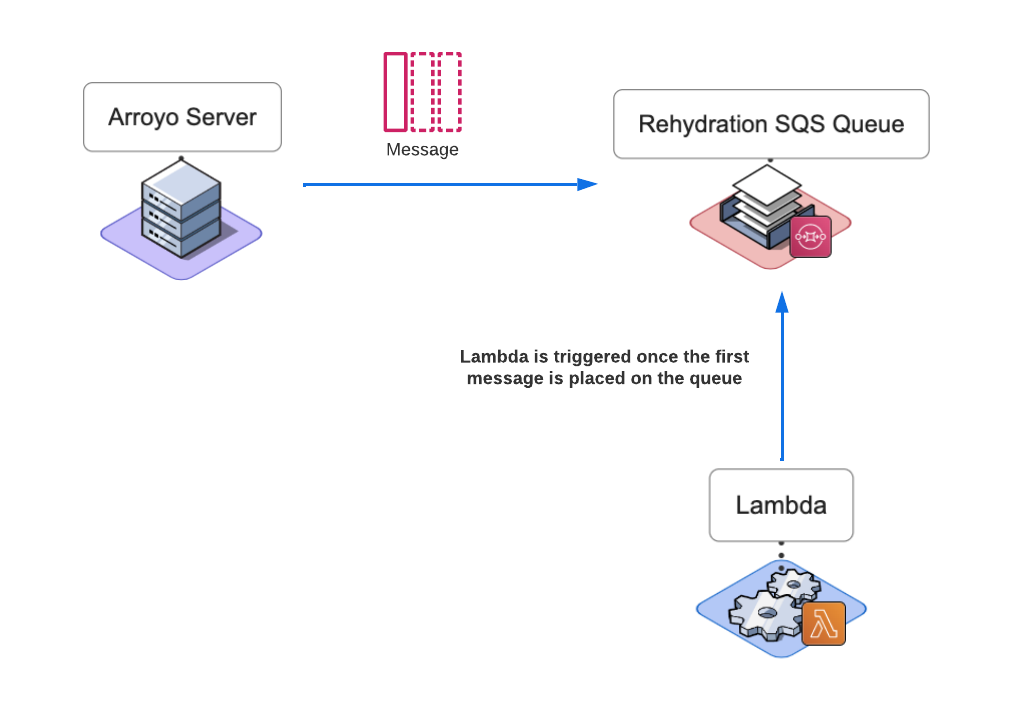
Lambda picks up a message from the queue and, based on its contents, will do one of two things:
- If the message body contains a SQL expression, Lambda will use that SQL expression to query the file, otherwise
- the Lambda will fetch the whole file.
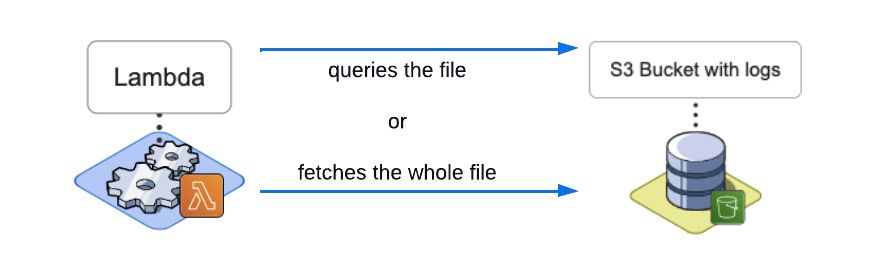
Now let’s explore how the log file is queried in more detail.
Querying JSON files with Amazon S3 Select
Arroyo performs the query by utilizing the Amazon S3 Select feature. S3 Select allows for retrieving a subset of data from an S3 bucket by submitting a query request containing a simple SQL statement. The log data stored in the S3 bucket must be in JSON format. Although S3 Select supports CSV or Apache Parquet in addition to JSON, Arroyo currently only supports JSON format.
To query the logs with S3 Select Arroyo uses the selectObjectContent action with the AWS SDK to create and submit a query request. Using keywords provided by the user Arroyo dynamically creates a SQL expression and then includes it in the request. Arroyo also specifies any matches to be serialized and returned in JSON format. Once Amazon S3 receives the request, it parses the data into records and returns the records that match the provided SQL expression.
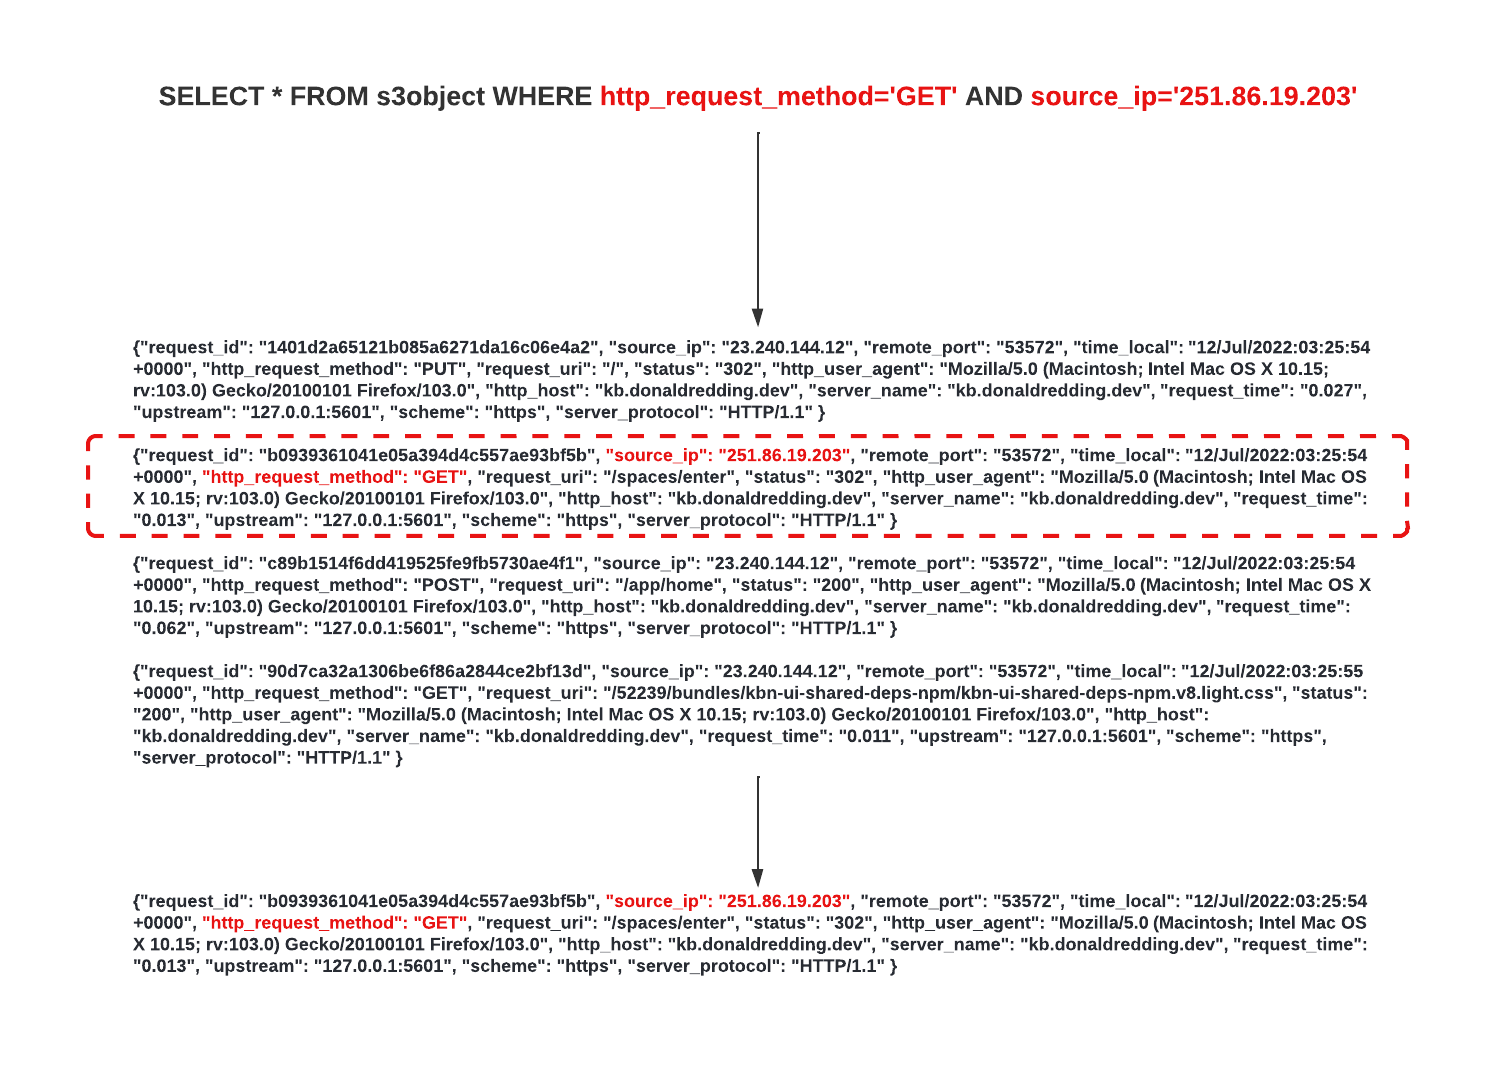
The ability to query individual log files and retrieve a subset of the files' contents drastically reduces the amount of data re-ingested into the user's ELK stack. For example, if the bucket contains 10,000 log files, each log is 32 Kilobytes in size on average; Let's assume that only 5% of the logs have relevant data. With bulk re-ingest, this would result in 320 Megabytes being introduced into a user’s ELK stack Considering that only 5% of the data would match the provided query, if we do query-based re-ingest instead, it will result in 16 Megabytes, which is 20 times less.

Reingest
During the Reingest phase, Arroyo needs to forward the log data fetched from the S3 bucket by the Lambda to the Logstash endpoint so that Logstash can pass it to Elasticsearch for indexing. Now let’s take a look at how exactly this happens.
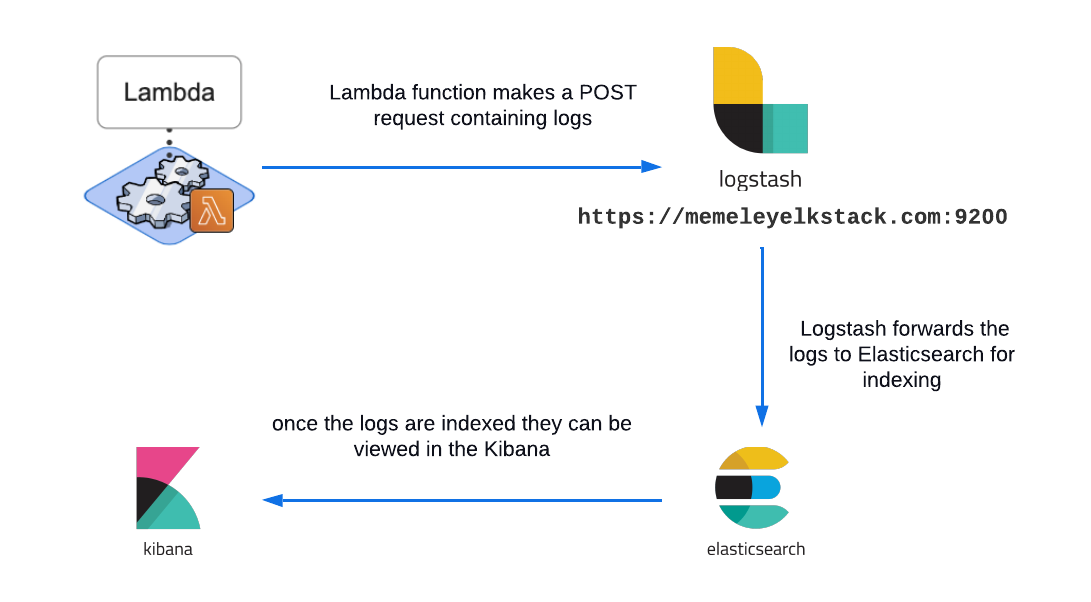
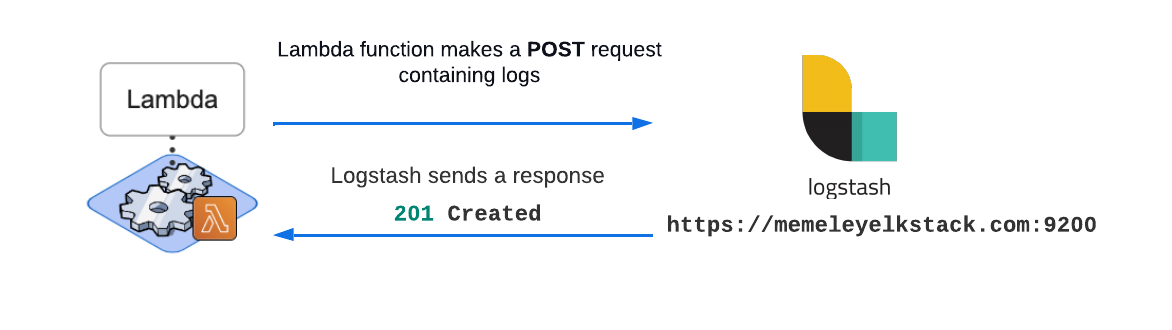
The Lambda function makes a POST request containing rehydrated logs to the Logstash endpoint provided by the user. Once this request is complete, Logstash forwards the logs to Elasticsearch. After Elasticsearch indexes the logs, they are ready to be viewed in the Kibana dashboard.
But how does the Arroyo Client know when the reingestion job is completed so that it can notify the user? Let’s take a look at how that happens.
Notify
During the Notify phase, the Arroyo Client needs to be notified about the outcome of the rehydration request that was processed during Rehydrate and Reingest phases so that it can let the user know when rehydration is complete.
Once the logs have been rehydrated and forwarded to Logstash by Lambda during the Rehydrate and Reingest phases, the Arroyo Server needs to send an event to the Arroyo Client about whether or not the rehydration request was processed successfully.
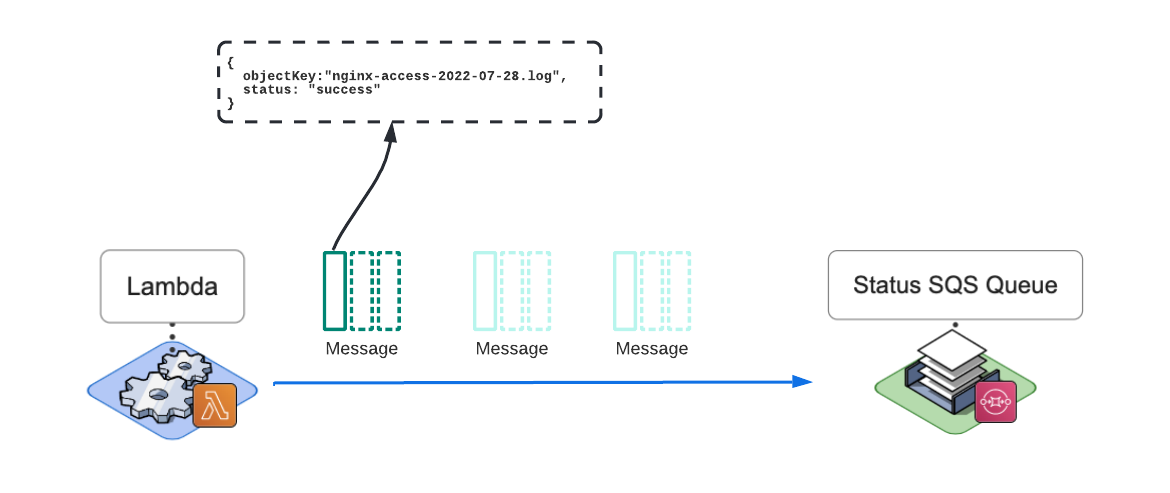
After the logs are POSTed to the Logstash endpoint during the Reingest phase, Lambda gets a response from Logstash.
It grabs the response data and packages it into a message containing the name of the log file (objectKey) sent and the request's status (status). It then places that message onto a Status SQS queue. The goal of the Status queue is to hold the status of the reingestion tasks for the Arroyo server to pick up.
At the same time, here is what happens on the Arroyo application server side.
Once the Arroyo Server finishes sending all of the messages to the Rehydration Queue, it starts polling the Status Queue.
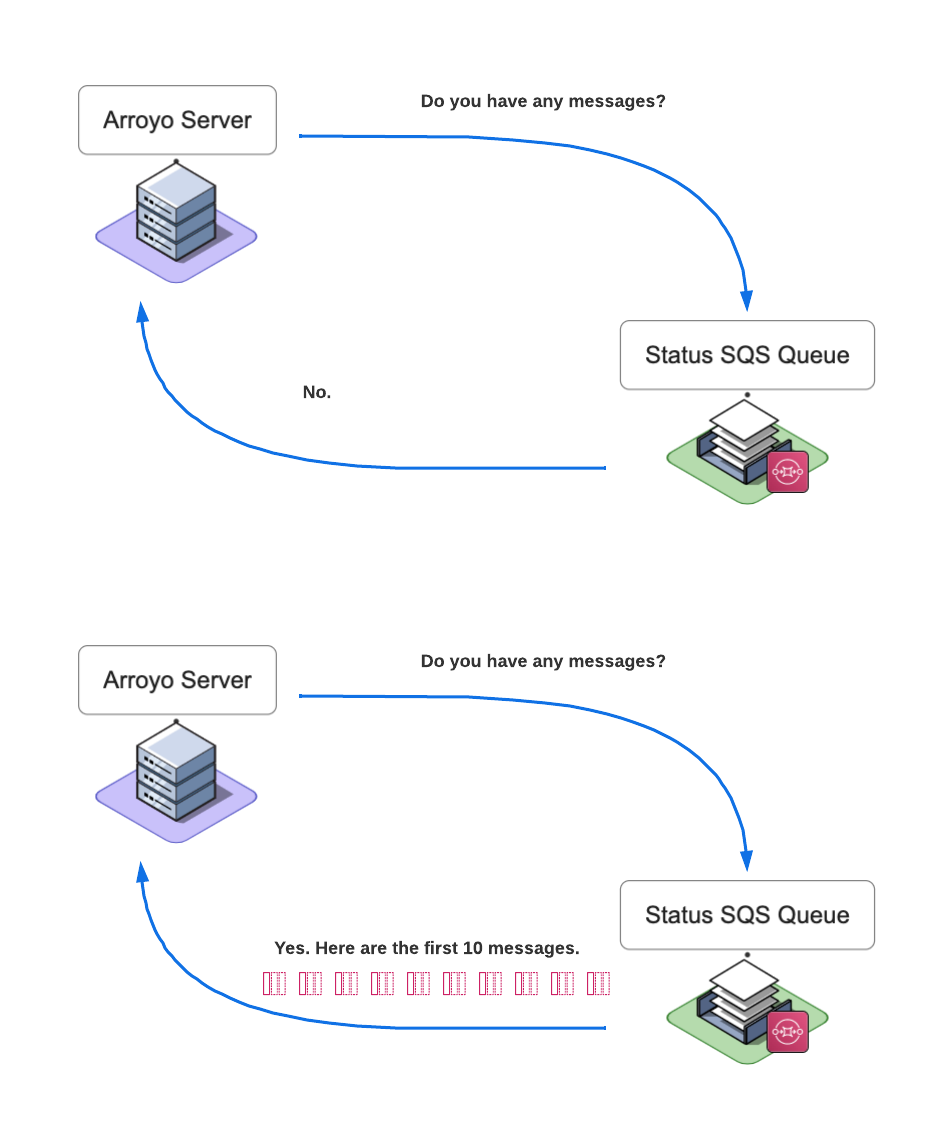
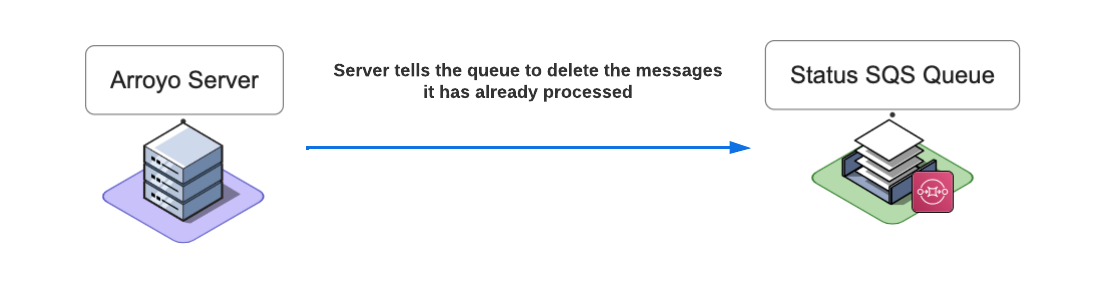
The Arroyo Server is configured to receive at most ten messages from the Status Queue at a time. The body of each message contains the key field, which represents the name of the file that Lambda processed, and the status field that indicates the request's status. The Arroyo Server saves the body of each message and the corresponding receipt handle. Once the message is processed, the Arroyo Server tells the Status Queue to delete it by providing the message receipt handle.
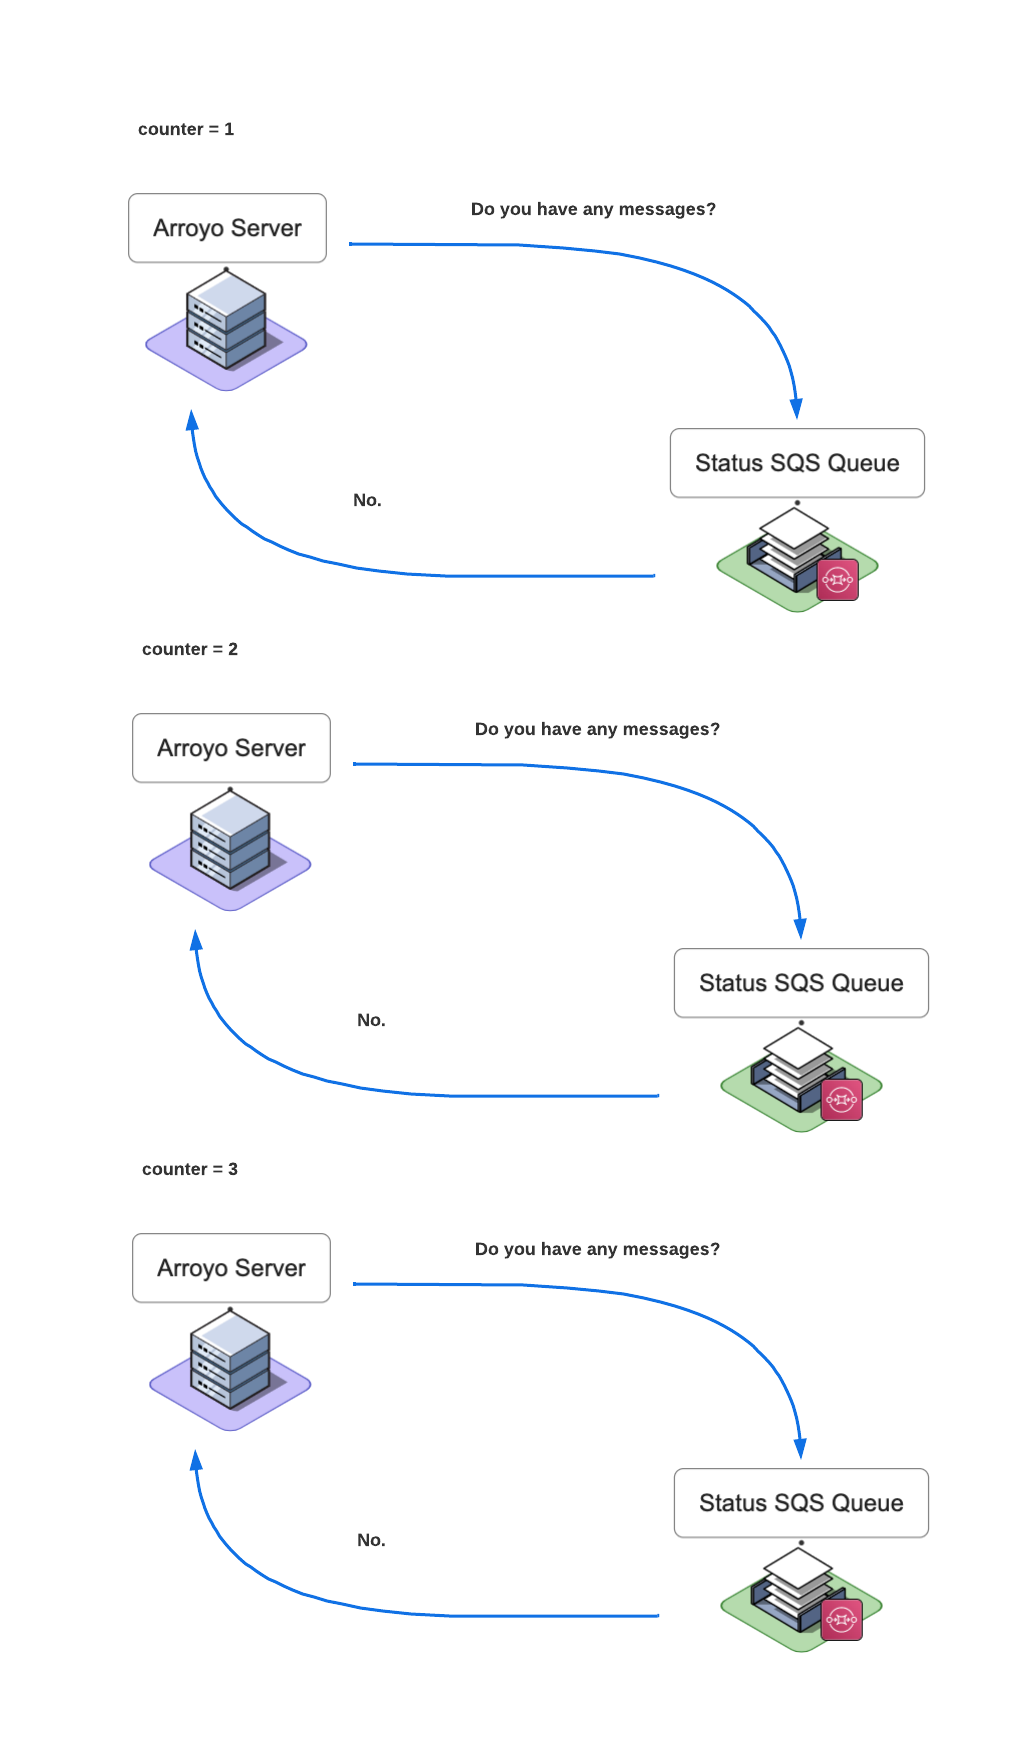
The Arroyo Server continuously polls the Status Queue for any new messages. It increments the counter once it gets a “No messages” response from the Status Queue. Once the counter is incremented three times, the Arroyo Server determines that there are no more messages and stops polling the queue.
Once there are no more messages on the Status Queue, the Arroyo Server sends a single notification to the Arroyo Client via a server-sent event.
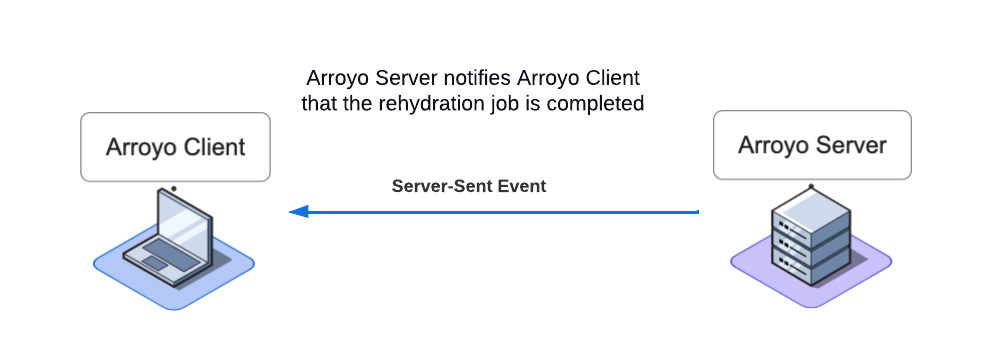
The Arroyo Client receives the notification event and then notifies the user via a toast message.
8. Engineering Decisions
While developing Arroyo, we encountered a number of engineering challenges:
- How do we make sure that we rehydrate logs without overwhelming Logstash service?
- How do we ensure that Arroyo SQS queues are not blocked by any problematic messages?
- How do we collect the status of a reingestion job and then notify the client of its subsequent completion?
Log Rehydration via Message buffer
To re-ingest logs from an Amazon S3 bucket, Logstash can be configured to access the bucket directly and re-ingest all the logs it contains. An input plugin allows Logstash to read a log event from a specific event source. For example, with the S3 input plugin, the S3 bucket is set as the event source.
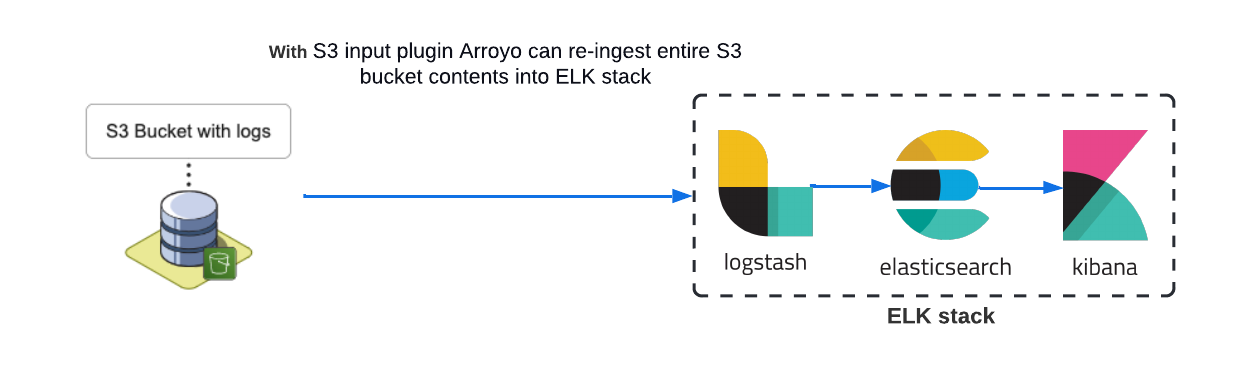
Using the S3 input plugin for our use case can be problematic because we do not need to re-ingest the entire bucket contents. This plugin does not allow us to specify files in the S3 bucket that we want to ingest into Logstash. We need to be able to re-ingest only the logs that fall within the provided date range or the logs that fall within the provided date range and contain the keywords provided by the user. One way to achieve that is to use the Logstash HTTP input plugin which allows Logstash to accept logs via HTTP or HTTPS.
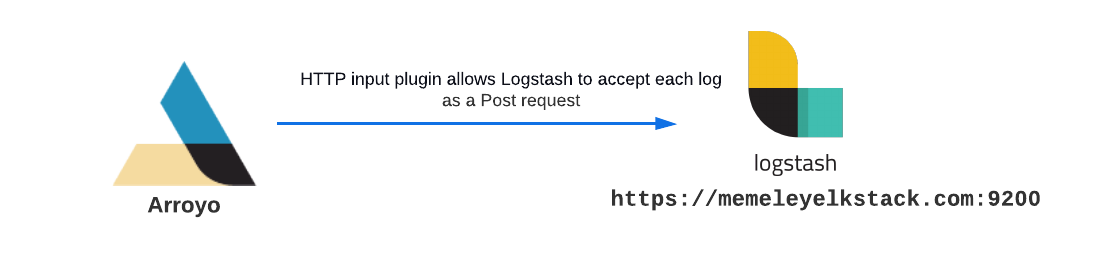
With the HTTP input plugin, we could send each rehydrated log or a whole log file as a POST request. However, there is a problem with this approach. If the number of rehydration tasks and POST requests to Logstash becomes unusually high, we could potentially overwhelm the Logstash service. Suppose a user submits a single rehydration request containing thousands of log files. In that case, there is a chance that Logstash won’t be able to process all incoming POST requests because of an exceptionally high rate of incoming requests. Some earlier requests may end up timing out, and for some new requests, Logstash may respond with 429 (Too Many Requests), resulting in lost log data.
To protect Logstash from being overwhelmed, we need to add a buffer. The buffer would serve as the event source and would allow Arroyo to queue the messages containing logs. A different component would take the messages off the buffer and process them.
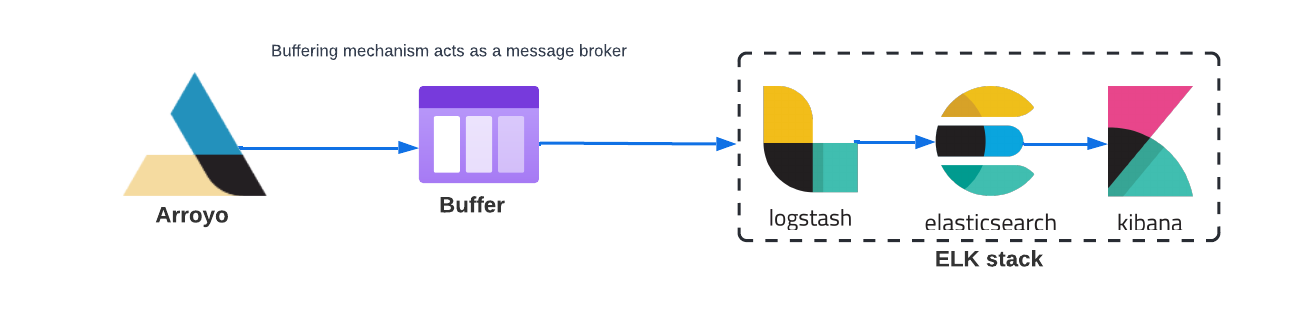
Adding a buffer would provide for better performance and reliability of the whole application because the messages can be processed at a rate that doesn’t overwhelm Logstash.
Possible Solution: Kafka
The first solution we came up with was introducing Kafka into our architecture.
Apache Kafka is a publish-subscribe messaging system. Kafka would serve as the middleman between the Arroyo application and the user's ELK stack.
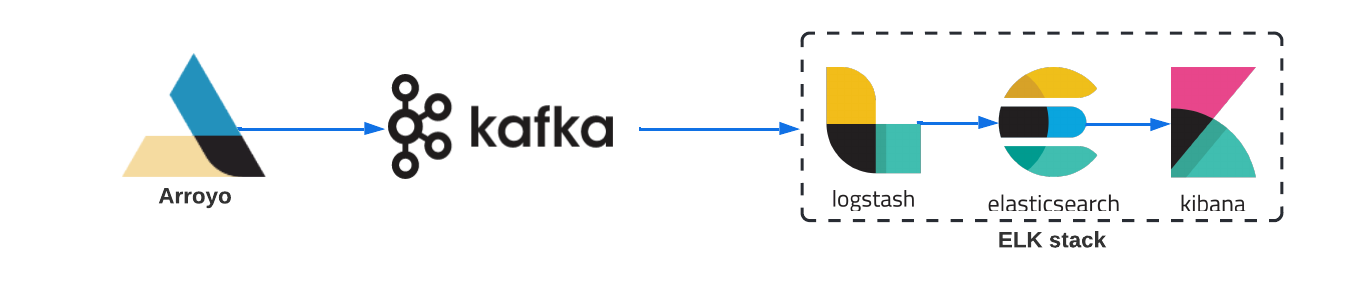
To integrate Kafka, we would have to create and deploy a Kafka Producer, a Kafka Broker, and configure the Logstash Kafka input plugin so that Logstash can accept Kafka events.
The Kafka Producer would be responsible for publishing logs as events to the Kafka topic. The Producer can either be a part of the Arroyo Server or a standalone application.
The Kafka Broker is a Kafka server that would be responsible for receiving and queueing the log data. We would also have to provision a separate server, most likely an Amazon EC2 instance, to host the Kafka Broker.
If we were to incorporate Kafka into our architecture, we would be able to have complete control over which logs are ingested and also ensure that the Rehydration and Reingestion layers are decoupled from the Arroyo Server logic.
This approach would work well, but after conducting more research, we concluded that setting up and managing Kafka comes with extra operational overhead. We were looking for a solution that is easier to set up and manage that is also highly scalable.
Solution: AWS SQS and AWS Lambda
We ended up implementing a combination of Amazon SQS Queue and an AWS Lambda Function.
The Queue would serve as a buffer, and the Lambda would perform rehydration and reingestion tasks.
Amazon Simple Queue Service (SQS)
Amazon Simple Queue Service is a fully managed solution that allows developers to create, use and manage a queue easily.
Using a queue allows us to create a buffer between the Arroyo Server and the Reingestion and Rehydration layers to prevent Logstash from getting overwhelmed.
The downside of this choice is that introducing new components like an SQS queue increases the overall complexity of the application. But even with the increased complexity, it made more sense for our use case to go with SQS since it is much easier to set up and manage than Kafka.
AWS Lambda
AWS Lambda is a serverless compute service that allows code to be run without provisioning servers. It is easily integrated with SQS. In our case, we programmatically created both an SQS Queue and an AWS Lambda function. We then set the SQS Queue as the Lambda function's trigger so that Lambda automatically spins up and performs rehydration and reingestion tasks once the Queue receives a message.
The main benefit of using a Lambda is that it takes on the execution of the rehydration and reingestion functions, freeing up our backend server to perform only essential tasks such as coordinating with the Arroyo Client and keeping track of the rehydration job's status.
The downside of using the Lambda function is that deploying it programmatically still requires a lot of work. To deploy the Lambda function, we had to create a separate S3 bucket and then upload Lambda's deployment package to it. The deployment package is a zip file containing all of the Lambda function's code and dependencies. Additionally, we had to create a separate IAM role and then attach it to Lambda so that it could access other AWS services.
Handling failed queue messages
Once we decided that using an Amazon SQS combined with an AWS Lambda works best for our use case, the next issue we needed to consider was how to ensure that the queue would not be blocked by any messages that the Lambda can’t consume. Message processing can fail for many reasons, such as issues in the lambda code, corrupted message payload, or network errors.
Possible Solution: Error handling in Arroyo Server code.
The first approach we considered was adding more error handling and “retry” logic to the Server code. Upon further investigation, we realized that the logic required to implement this might be very complex because there is an infinite number of scenarios we would need to capture.
Solution: A Dead Letter Queue
A Dead-letter Queue (DLQ) is a queue that is created specifically to hold messages that can’t be consumed. It allows us to put aside failed messages so they don’t block the main queue.
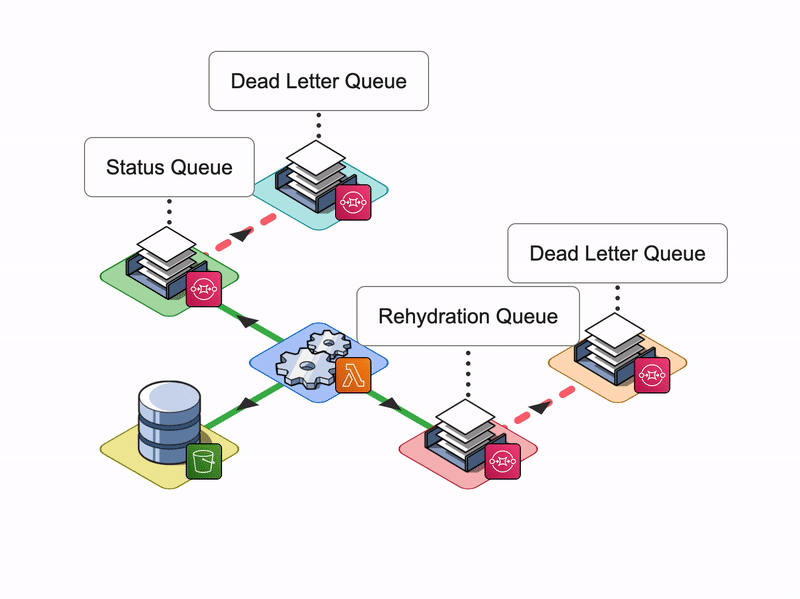
Once the main queue receives a message, Lambda is triggered where it then attempts to process the message a specified number of times. If the message processing continues to fail and the SQS queue message retention is set to a relatively long period of time, or if the volume of messages is large, there is a chance of failed messages blocking the main queue.
A DLQ ensures that the main queue is not blocked and can recover quickly. If Lambda is unable to process the messages that are on the main queue, the messages are automatically transferred to the Dead Letter Queue.
With Dead-letter Queues, developers can configure alarms to signal when messages are transferred to a Dead Letter Queue, indicating that some error has occurred. Then they could attempt to reprocess the messages by redirecting them back to the main queue or examine logs to investigate what has caused the message processing to fail.
Notifying the Client
While developing Arroyo, we needed to ensure that the Client has visibility into the status of rehydration tasks and is notified of a task’s completion.
To achieve that, we needed to access the result of each POST request sent to Logstash, combine the results of all requests, and pass them to the Arroyo application.
Possible Solution: Webhook
The first solution we considered involved setting up a webhook.
A webhook is an API endpoint that accepts a data payload from a different service which in turn triggers some event.
Our backend would expose an endpoint - a webhook - that would accept POST requests, and each POST request would contain a status of a single reingestion job. We would need the user to provide a host or an IP address of the machine where the Arroyo application is deployed, and then we would need to pass that information to the Lambda function so that it would know where to send the POST request with the status.
This approach seemed like a viable solution. However, in this case, the Notification layer would be tightly coupled with the rest of the logic. Which we wanted to avoid because tightly coupled systems are harder to maintain and scale since their components are too dependent on each other.
Status SQS Queue
We decided to implement a second SQS queue, the Status SQS queue.
Once Lambda receives the response from Logstash, it will place a message containing the result of the request onto the Status SQS Queue. The Arroyo backend server would pick up and then process the message. Once all messages are processed, it will notify the Client.
The main benefit of this approach is that this setup allows us to keep the Notification layer decoupled from the Rehydration and Reingestion layers which ensures that our system is easy to scale and update in the future.
9. Future Work
Improved Visibility
As Arroyo currently exists, a user is notified within the Arroyo client UI when a rehydration task is initiated or completed. This simple notification system may work well for smaller rehydration tasks with relatively short processing times. However, a user might feel left in the dark if processing times were to increase due to increased log volume or network latency.
Developing a more robust system to notify users is one of Arroyo’s main goals moving forward. For example, we want to notify users at various stages within the rehydration process and improve error messaging in the case that a job fails.
Improved Searching

In the future, our team would like to expand Arroyo to be able to perform full-text searching to facilitate support for other log formats. We acknowledge that full-text searching is challenging at the best of times, but the ultimate goal would be to provide more flexibility for end users.
Another search-related feature our team would like to improve is Arroyo’s query rehydrate feature. Currently, Arroyo supports a maximum of two log attributes to search and rehydrate logs conditionally. We would like to enhance Arroyo's SQL expression-generating logic to support more complex queries.
More Flexibility

At the moment, Arroyo only integrates with AWS S3. Moving forward, our team would like to develop a strategy to support other cloud storage providers. Our team acknowledges that this is a non-trivial task and would require a significant redesign of our application. Our ultimate goal would be to extend the benefits of log rehydration to a broader range of use cases.
10. Presentation
11. References
- Merriam-Webster
- Logstash Reference [8.3] | Elastic
- Elasticsearch Guide [master] | Elastic
- Kibana Guide [8.3] | Elastic
- Concepts | OpenTelemetry
- Lessons from Building Observability Tools at Netflix | by Netflix Technology Blog
- Optimize Lambda scaling when using Amazon SQS event sources
- Using Amazon SQS Dead-Letter Queues to Control Message Failure
- Amazon SQS dead-letter queues
- Creating a role to delegate permissions to an IAM user - AWS Identity and Access Management
- Best practices for working with AWS Lambda functions
- Introducing support for Amazon S3 Select in the AWS SDK for JavaScript | AWS Developer Tools Blog
- Policies and permissions in IAM - AWS Identity and Access Management
- Data Pipeline from Kafka To Elastic-search using logstash | by Eresh Gorantla | Geek Culture | Medium
- Filtering and retrieving data using Amazon S3 Select
- Http input plugin | Logstash Reference [8.3] | Elastic
- S3 input plugin | Logstash Reference [8.3] | Elastic
- What are webhooks?